

Site selection is a spatial problem disguised as a spreadsheet
Every development decision comes down to one question: is this parcel the right piece of land for this project, at this price, right now? Answering it well means weighing dozens of factors that are all fundamentally geographic — what the land is zoned for, who lives within a ten-minute drive, whether it sits in a floodplain, how far the nearest sewer main runs, what competitors already occupy the trade area. Yet most site-selection teams still manage this in spreadsheets and a scatter of PDFs, public GIS portals, and broker emails.
Spreadsheets fail here for a specific reason: they have no concept of where. A row can tell you a parcel is, say, four acres and zoned for commercial use, but it cannot tell you that the buildable portion shrinks by half once you remove the mapped flood zone and the wetland buffer, or that a promising cluster of target households is actually split by a highway that pushes many of them well outside a reasonable drive. Distance, adjacency, overlap, and travel time are the whole game in real estate, and they are exactly what a tabular view cannot represent. The result is slow, manual screening, inconsistent comparisons between sites, and decisions that are hard to defend to an investment committee.
The GIS data layers that actually drive a decision
A proper screening model assembles many independent datasets into one spatial frame, so that each parcel carries the attributes of everything it touches. The layers that matter most:
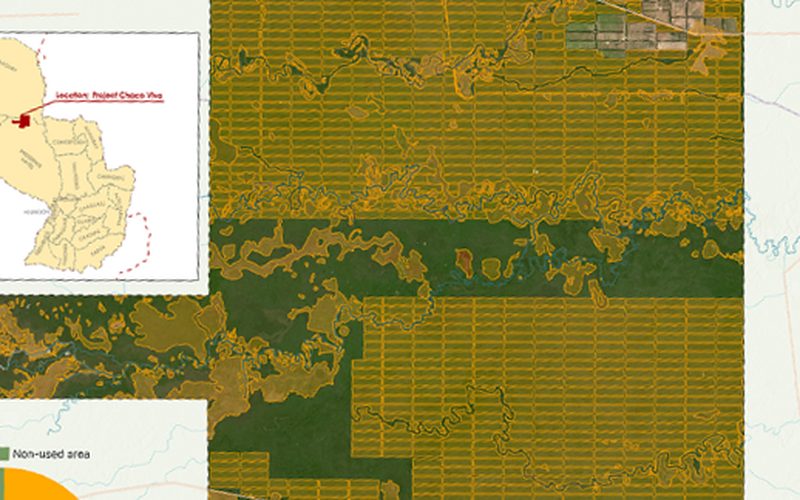
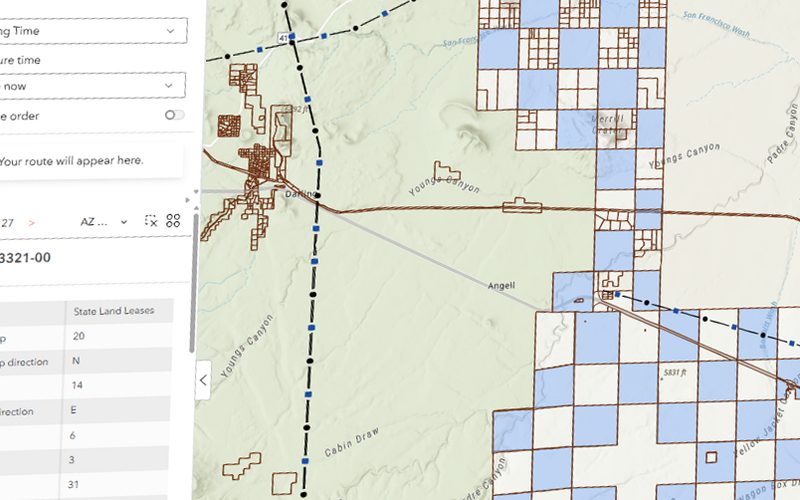
- Parcels, zoning and land use — the foundation. Parcel geometry with ownership, acreage, assessed value, existing use, and the zoning code that dictates permitted uses, density, height, setbacks and parking. This is where a candidate list is born and where most sites are eliminated first.
- Demographics and socioeconomics — population and its growth trajectory, household counts and formation, median and disposable income, age structure, and daytime versus residential population. For retail, multifamily, or senior housing, the trade-area profile is often the deciding variable.
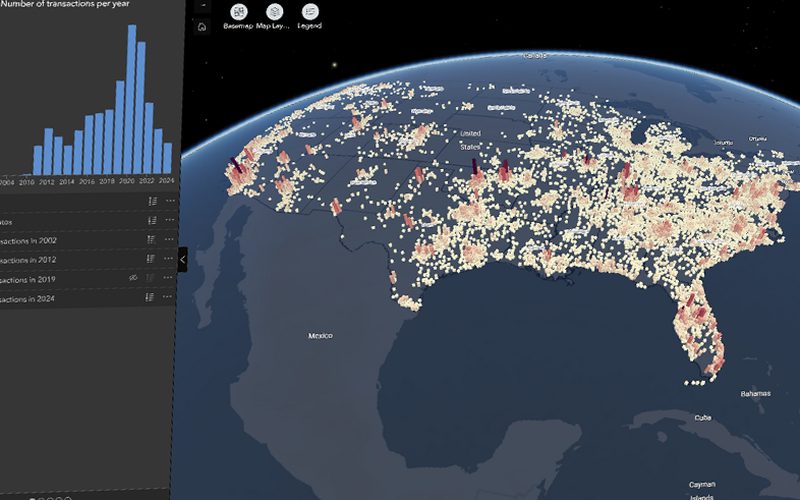
- Market data — sales and lease comparables, absorption rates, rent and price per square metre, vacancy, and pipeline supply. Geocoded and mapped, comps reveal micro-market boundaries that a list of addresses hides.
- Environmental and natural-hazard risk — flood zones, wildfire exposure, slope and terrain, soil bearing capacity and liquefaction, seismic zones, wetlands, and protected or conservation areas. These layers rarely make a site attractive, but they routinely make one un-developable — and finding that out late is one of the most expensive mistakes in the business.
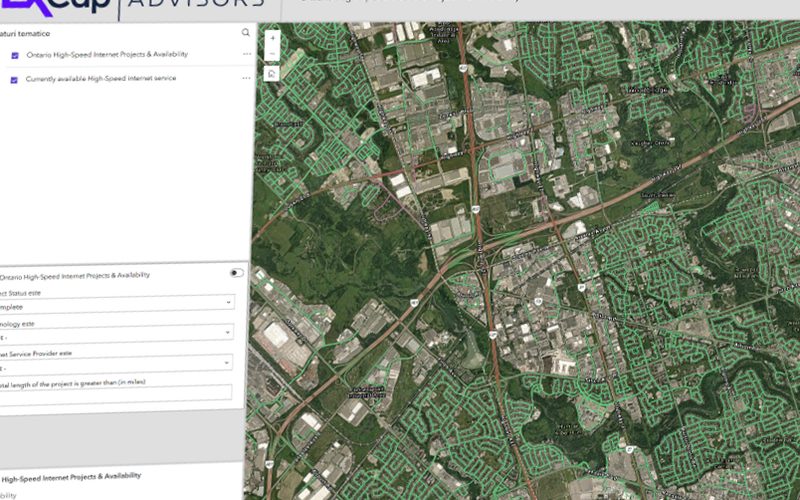
- Infrastructure and utilities — proximity and capacity of water, sewer, electricity, gas and broadband. A cheap parcel far from the nearest sewer trunk can carry a large extension cost that erases the discount.
- Transportation and accessibility — drive-time isochrones, transit stops and frequency, road network, traffic counts, and highway access. Accessibility is not straight-line distance; it is travel time across a real network.
- Points of interest and competition — anchors, employers, schools, healthcare, and the location and size of direct competitors. Trade-area capture depends on who is already there.
Suitability analysis: turning many layers into one ranked list
Having the layers is not the same as having an answer. Suitability analysis is the step that converts them into a single, comparable score per parcel. The standard technique is a weighted overlay, a form of multi-criteria decision analysis.
The mechanics are straightforward and, crucially, transparent:
- Encode each criterion as a spatial layer and normalize it to a common scale — say 0 to 100 — so that acreage, income, and distance to sewer can be compared on equal terms.
- Define scoring rules per criterion. Drive time under ten minutes might score 100 and decay to 0 by twenty-five minutes; any parcel intersecting a flood zone is knocked to zero or removed outright as a hard constraint.
- Weight the criteria to match the developer's priorities. A grocery-anchored retail model might weight daytime population and traffic heavily; a logistics developer weights highway access and parcel size.
- Combine the weighted scores into a composite index and rank every parcel against it.
The output is a defensible shortlist: not just which parcels win, but why, expressed as a breakdown of contributing factors. Because the weights are explicit, the model is also a negotiation and sensitivity tool — change the assumptions, watch the ranking shift, and understand exactly how robust a favorite really is.
Web visualization: the screening tool stakeholders actually use
Analysis buried in a desktop GIS project helps one analyst. The payoff comes when the model lives in an interactive web application that the whole deal team can open in a browser. That is where screening becomes a shared, fast, repeatable process.
An effective web-GIS screening tool typically offers:
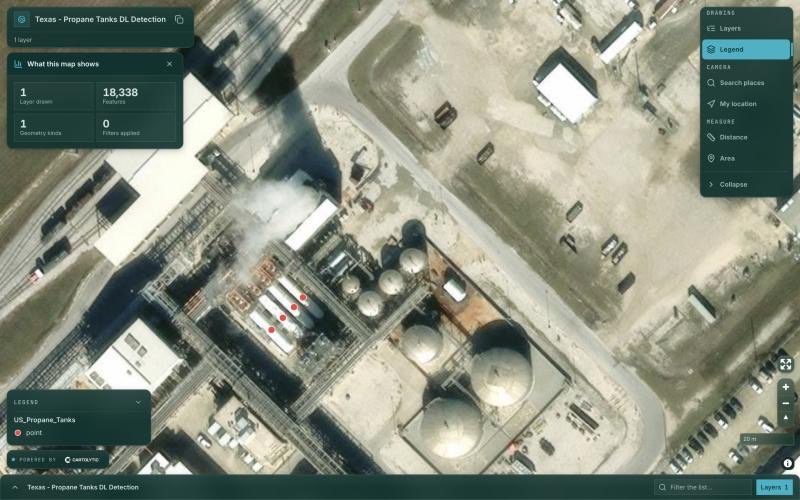
- An interactive parcel map where every parcel is clickable and carries its full attribute profile and suitability score.
- Filterable dashboards — set minimum acreage, zoning class, maximum flood risk, or drive-time reach, and watch the candidate set narrow instantly.
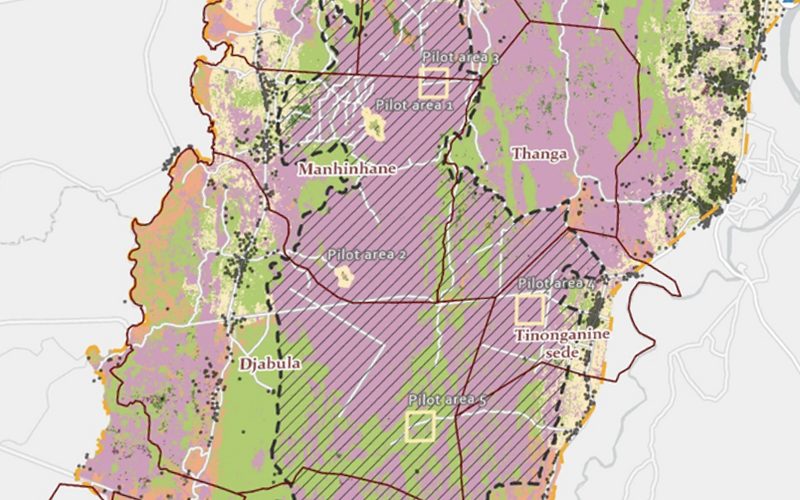
- Demographic heatmaps that reveal income, growth, and density gradients across the market at a glance.
- Risk overlays for flood, slope, wildfire and protected areas, toggled on and off over the parcels.
- Drive-time catchments drawn live from any candidate site, with the population, households, and competitors inside each isochrone summarized on the fly.
- Shareable views and exports so a screening result becomes a slide in an investment memo without re-keying anything.
The difference in tempo is dramatic. What took an analyst days of manual cross-referencing per market becomes a live filter that a principal can run themselves in the meeting.
An end-to-end workflow
In practice, a GIS-driven site search follows a consistent arc:
- Define criteria. Translate the investment thesis into explicit, measurable rules — target uses, size range, demographic thresholds, hard constraints, and relative weights.
- Assemble the layers. Source, clean, and align parcel, zoning, demographic, market, hazard, utility, and transportation data into one spatial database, projected and standardized.
- Score. Run the weighted overlay, apply hard constraints, and generate a composite suitability index for every parcel in the search area.
- Shortlist. Rank and filter to a defensible top set, review it on the interactive map, and pressure-test the weights.
- Due diligence. Focus expensive human effort — site visits, title, environmental assessment, utility confirmation — only on the handful of parcels that survived the model, with the GIS profile as the checklist.
The payoff
Done well, spatial screening changes the economics of finding land:
- Speed — evaluate an entire region in the time it used to take to work up a single site, and enter new markets without a local analyst.
- Fewer bad bets — flood zones, utility gaps, and hostile zoning are caught in screening, not after an option payment.
- Defensible decisions — every recommendation carries an explicit, auditable rationale that stands up in front of a committee or a lender.
Work with Cartolytic
Cartolytic builds custom web-GIS screening tools and interactive maps for real-estate teams — assembling the parcel, demographic, market, risk, and infrastructure layers, encoding your investment criteria into a transparent suitability model, and delivering it as a browser-based tool your whole team can use. If you are spending too long finding the right land and want a faster, more defensible way to do it, get in touch and we will scope a screening tool for your markets.