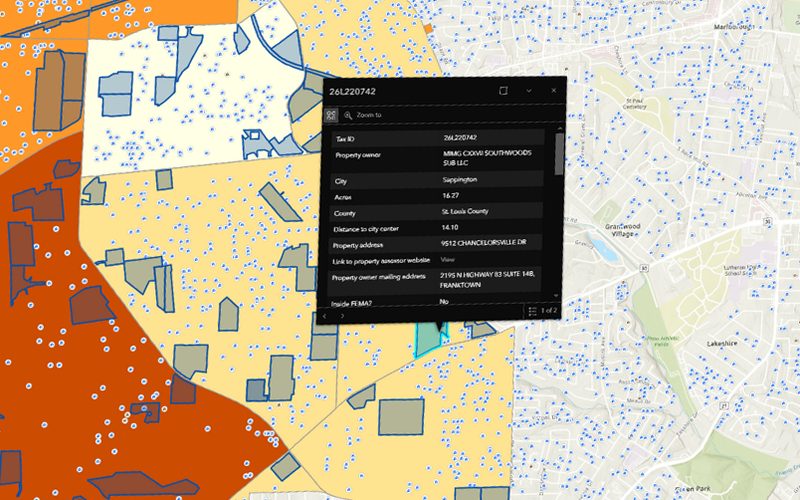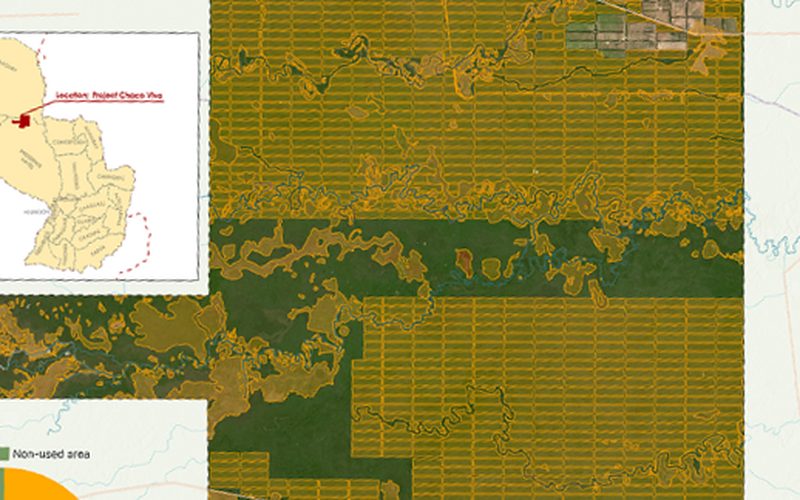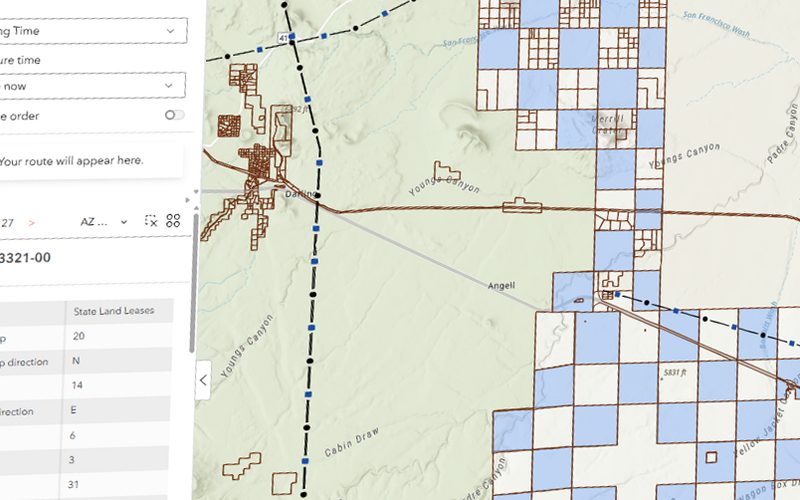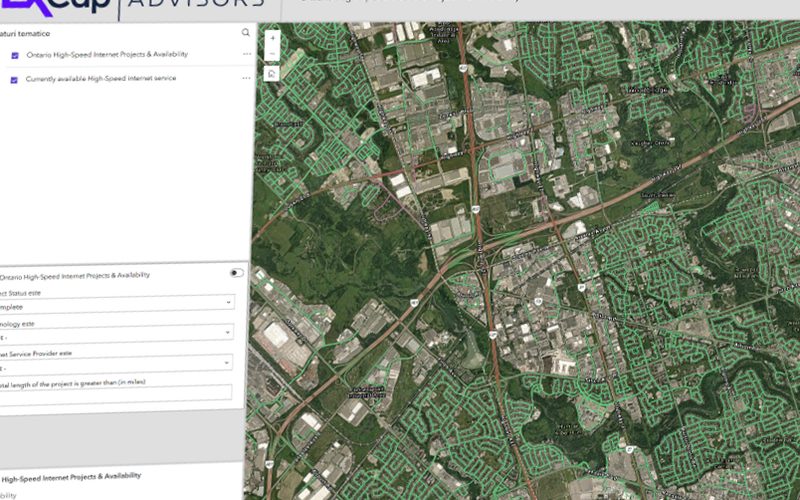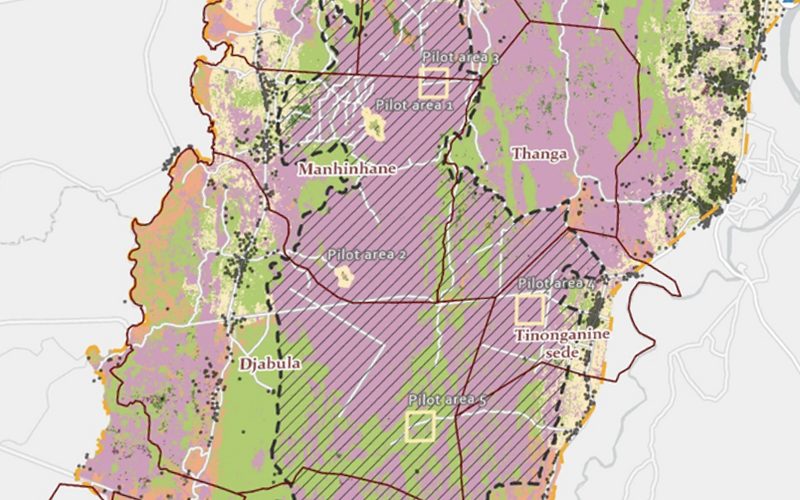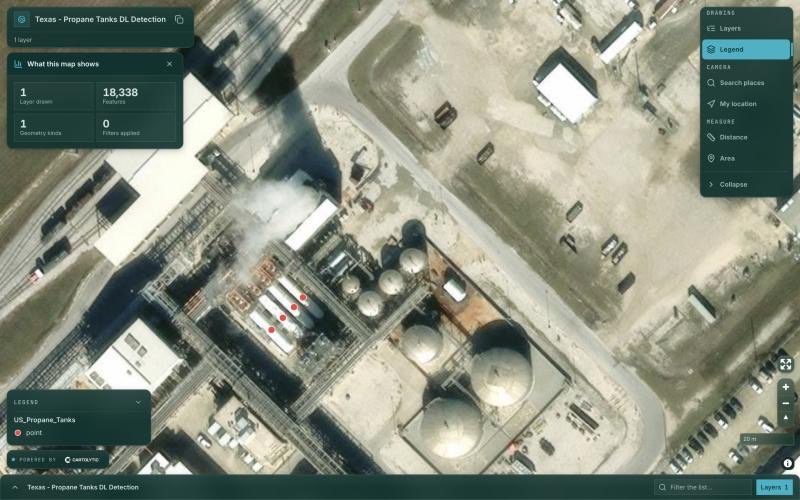


Industry analysts have long estimated that a large majority of business data — a figure often put at around 80% — contains a geographic component: an address, a postcode, GPS coordinates, a service area, a sales territory. The precise share is hard to pin down, but the direction is not in doubt. Yet most organizations analyze that data in spreadsheets and pivot tables that strip the location out entirely. They know what happened and when, but not where — and "where" is very often the variable that determines whether a decision succeeds or fails. Mapping and spatial analysis put that dimension back into the decision.
Why "Where" Is a Decision Variable
Location is rarely just a label on a record. It is a driver of outcomes. A store's revenue depends on the population, income, and competition within a realistic travel time. A wind farm's return depends on terrain, grid distance, and land constraints. A logistics network's cost depends on the geometry of routes between depots and customers. In each case the "right answer" changes as you move across the map — which means any analysis that treats all locations as interchangeable is systematically blind to its most important variable.
Spatial context also encodes relationships that tabular data cannot express: proximity, adjacency, containment, flow, and clustering. Two customers in the same postcode often behave more alike than two customers a hundred kilometers apart. A competitor across the street can matter more than one across the region. These are first-order effects in market analysis, and they only become visible when data is placed in space.
From Tables to Decisions People Can Act On
A map is not just a prettier chart. It is a different cognitive interface. A column of thousands of postcode-level sales figures is effectively unreadable; the same figures rendered as a choropleth immediately reveal where demand concentrates, where it thins out, and where a cluster of underperformance sits next to a competitor. The human visual system is built to detect spatial pattern, and mapping exploits that directly.
Crucially, maps translate analysis into action geometry. A model might output "expand in the south-east." A map outputs a specific catchment polygon, a ranked shortlist of candidate sites, and the streets a delivery vehicle should cover. That specificity is what lets an operations team, a real-estate lead, and a finance director look at the same picture and agree on the same move.
Core Applications in Market Analysis
- Market and trade-area analysis: defining the geographic area a location realistically serves, quantifying the addressable market inside it, and measuring overlap and cannibalization between existing sites.
- Catchment and drive-time analysis: replacing crude radius circles with isochrones — true travel-time boundaries that reflect the road network — to understand who can actually reach a location within 10, 20, or 30 minutes.
- Competitor mapping: plotting rivals against your own footprint and against demand to expose gaps, saturated zones, and defensible territory.
- Demographic and consumer profiling: enriching trade areas with census, income, age, household, and lifestyle-segment data to characterize the people inside each catchment, not just their count.
- Site selection and network/expansion planning: scoring candidate locations against demand, competition, accessibility, and cost, then sequencing a rollout that maximizes coverage while minimizing self-cannibalization.
- Risk and logistics: modeling exposure to flood, wildfire, or supply disruption, and optimizing depot placement, routing, and last-mile coverage.
Spatial-Analysis Techniques That Do the Work
Behind these applications sits a compact toolkit of analytical methods:
- Hot-spot and cluster analysis (for example Getis-Ord Gi*, LISA, kernel density) distinguishes statistically significant concentrations of sales, demand, or risk from random noise — turning "it looks busy there" into a defensible signal.
- Suitability and weighted scoring overlays multiple criteria — demand, competition, rent, accessibility, zoning — into a single ranked surface, so a shortlist reflects trade-offs explicitly rather than gut feel.
- Accessibility and isochrone modeling computes travel-time and travel-cost surfaces across the real network, the backbone of honest catchment and service-coverage analysis.
- Spatial joins and overlay attach attributes across datasets by location — assigning each customer to a territory, each site to a demographic profile, each parcel to a flood zone — so disconnected tables become one coherent, queryable layer.
Cross-Industry Examples
The illustrations below are representative use cases rather than specific client engagements, but each maps directly onto the techniques above:
- Retail: a chain uses drive-time catchments plus demographic enrichment to rank candidate sites, then hot-spot analysis on loyalty data to confirm which existing stores are cannibalizing each other before signing a new lease.
- Real estate: an investor scores neighborhoods on accessibility, income growth, and supply pipeline to identify undervalued submarkets before prices move.
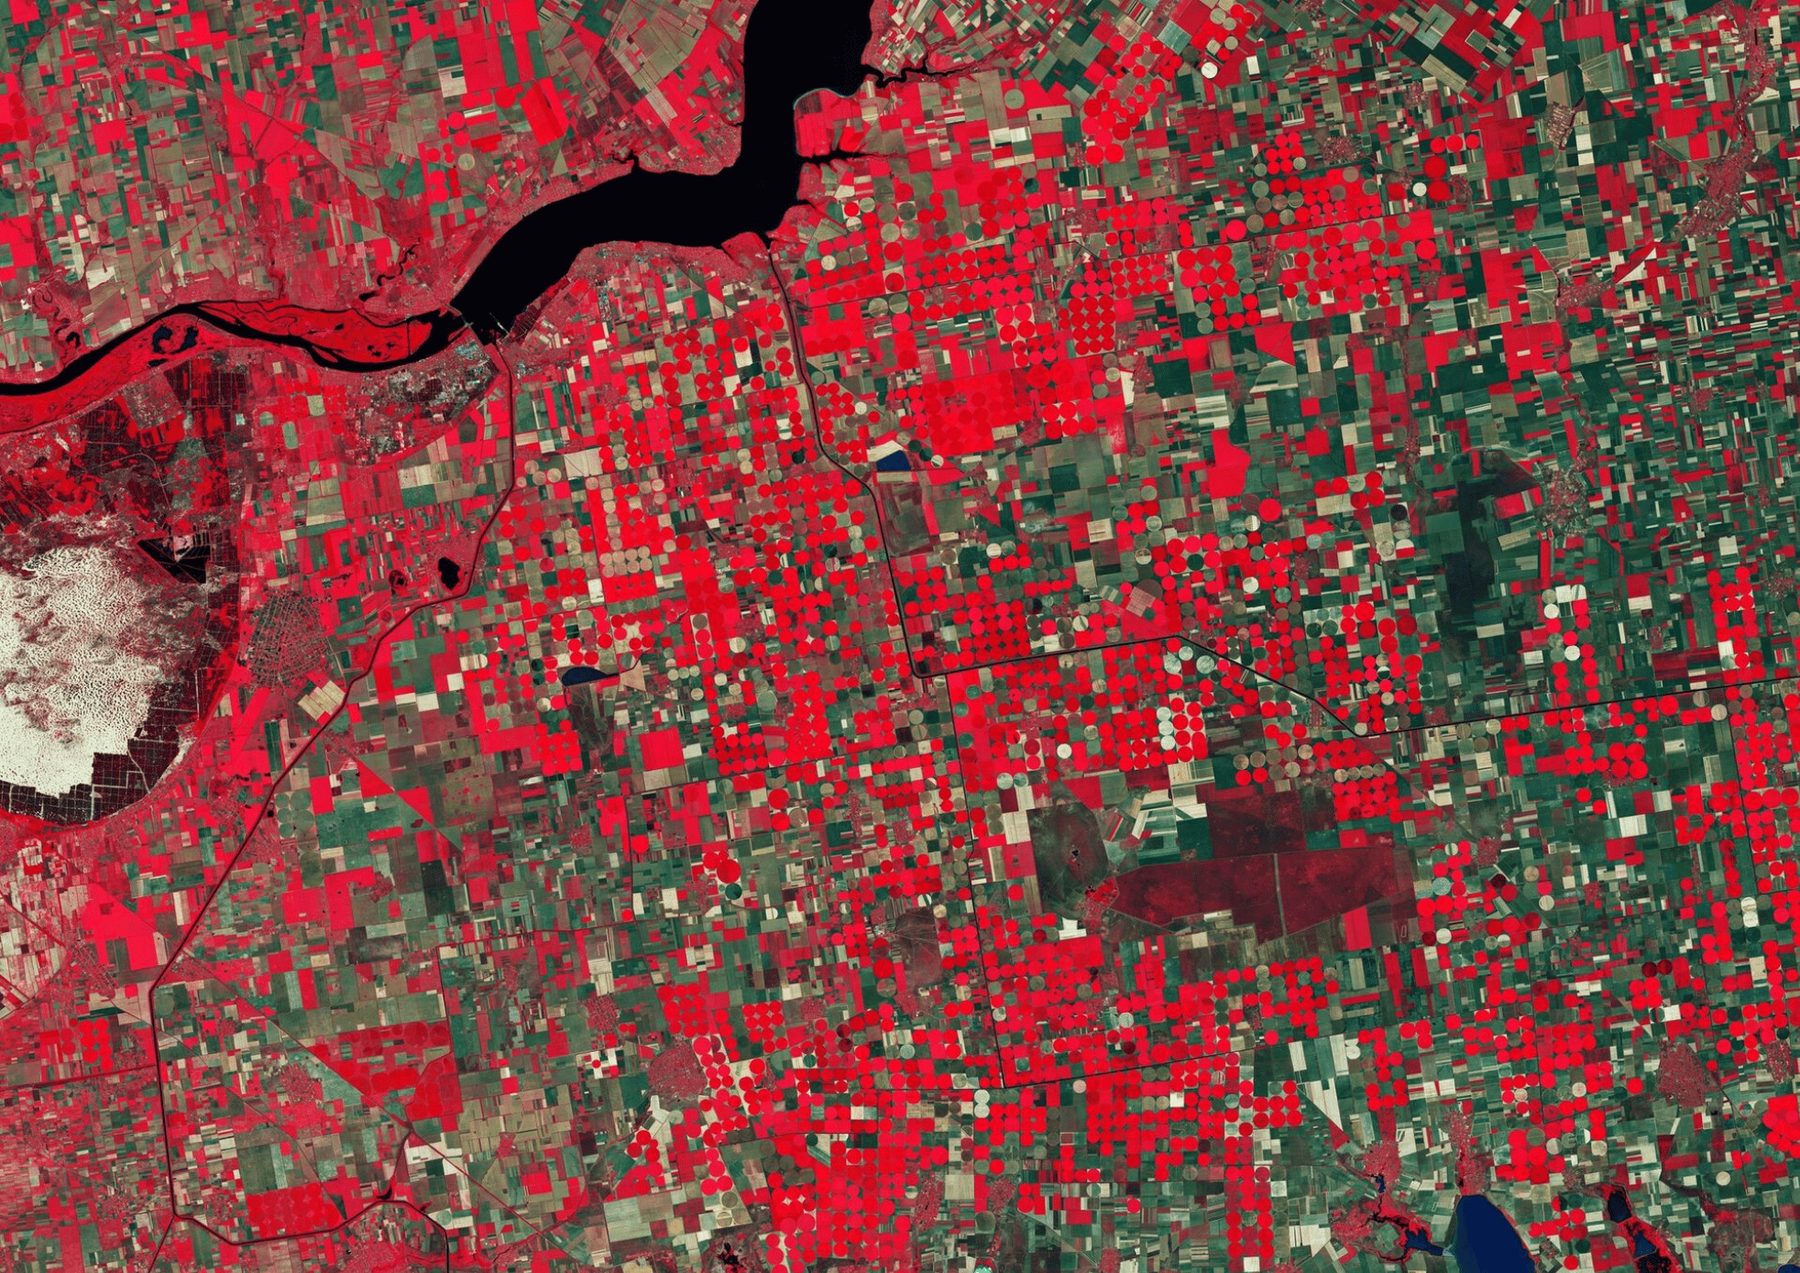
- Agriculture: a producer combines satellite-derived vegetation indices with soil and yield maps to target inputs field-by-field and forecast regional supply.
- Energy: a developer overlays wind or solar resource, slope, grid proximity, and land-use constraints into a suitability surface to prioritize sites and avoid costly dead ends.
- Public sector: a municipality maps service accessibility and demographic need to place clinics, schools, or transit stops where they close real gaps in coverage.
Web Maps and Dashboards: Aligning Stakeholders
Analysis that lives in one analyst's desktop file rarely changes a decision. Interactive web maps and dashboards are how spatial insight becomes shared, durable, and operational. A well-built web map lets a regional manager filter to their own territory, lets a finance director toggle scenarios, and lets a field team pull up the same catchment on a phone. It replaces the static PDF that ages the moment it is exported with a living layer that updates as the data does.
This is also where alignment happens. When every stakeholder interrogates the same map — panning, filtering, drilling into a specific site — debate shifts from "whose numbers are right" to "which option do we choose." Communication and decision-making converge on a single source of geographic truth.
The Cost of Ignoring Spatial Context
Ignoring "where" is not neutral — it is a source of expensive, recurring error:
- Opening a location whose radius-based market looked strong but whose real drive-time catchment is cut off by a river, a highway, or a competitor.
- Treating a region as one market when it is really several distinct micro-markets with opposite dynamics.
- Missing cannibalization until new stores erode the older ones' revenue.
- Optimizing logistics on straight-line distance and paying for it in real-world detours and fuel.
- Averaging away risk — reporting a portfolio as "low exposure" while a large share of it sits in a single flood plain.
None of these are analysis failures in the ordinary sense. They are the predictable result of throwing away the location dimension before the analysis even starts.
How Cartolytic Helps
Cartolytic delivers location intelligence, market and trade-area analysis, and custom web maps built for decisions rather than decoration. We combine GIS, remote sensing, and web-GIS engineering to turn your operational, demographic, and geospatial data into catchments, suitability models, competitor maps, and interactive dashboards your whole team can act on — from the first exploratory map to a production platform your stakeholders use every day.
If a decision on your desk depends on where — where to build, where to sell, where to invest, where the risk sits — talk to us about putting spatial analysis behind it.