

Most people who need a GIS suitability analysis do not need a lecture on geospatial theory. They have a decision to make — where to put the site, which parcels to shortlist, which route to defend — a budget, and a deadline. What they usually lack is a clear picture of what the work involves, what it should cost, and what to hand over to get a useful result. This post is that picture. It walks the full engagement end to end so you can scope your own project, ask sharper questions, and recognise good work when you see it.
What a suitability project actually is
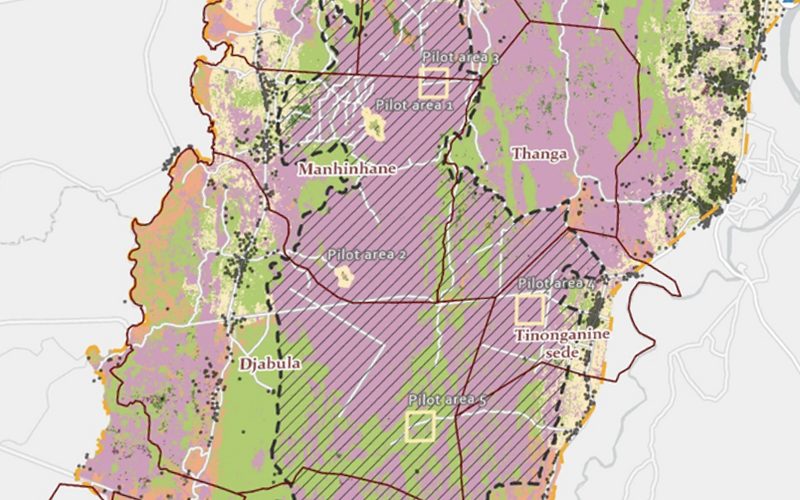
A suitability analysis answers a spatial question of the form "where is the best place to do X, given these constraints and preferences?" It is the discipline behind siting a solar farm, screening parcels for a development, choosing a store location, or ranking land for restoration. The engine underneath most of this work is multi-criteria decision analysis (MCDA): you translate a decision into weighted, mappable criteria, combine them, and produce a ranked surface or shortlist you can defend. It is the same evidence-based logic behind our broader work on spatial analysis for decision-making, and it underpins everything below.
What follows is the anatomy of a real engagement: five stages, each with its own decisions and its own effect on cost and timeline.
Stage 1 — Scoping the question
The single biggest predictor of a good outcome is a well-framed question. Scoping is where an analyst and client agree on four things:
- The objective. The actual decision, stated plainly — "shortlist five sites for a 20 MW solar farm within grid reach," not "look at solar potential."
- The criteria. The factors that make one location better than another, split into hard constraints (exclusions) and weighted preferences. This is where domain knowledge earns its keep.
- The study area. A concrete boundary. A county is a different project from a country, and the boundary drives data volume, resolution choices and cost.
- The deliverables. What you actually receive — a map, a shortlist, a report, an interactive tool, or all of them.
Time invested here is never wasted. A vague brief produces a vague map, and revision rounds to fix it are the most expensive way to discover the question was never pinned down.
Stage 2 — Data assessment
Once the criteria exist, each one needs a data layer, and every layer falls into one of three buckets: it already exists as open data, it must be bought, or it must be created from scratch. A large part of an analyst's value is knowing which is which before the meter starts running.
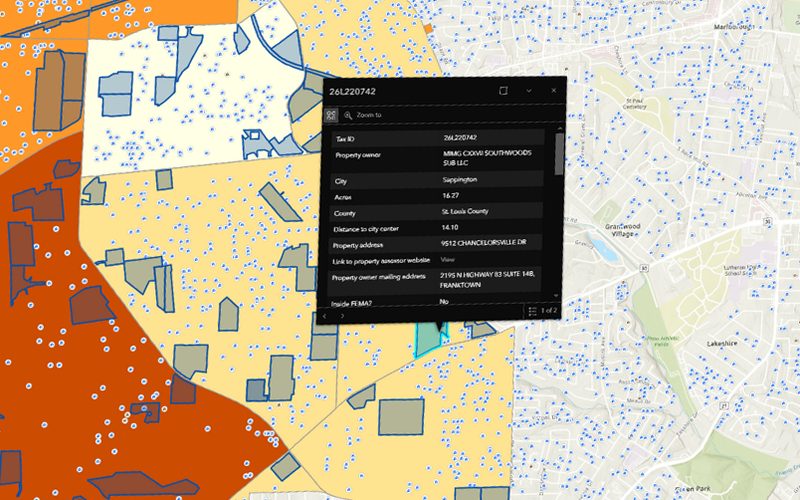
Here we owe you candour, because it builds trust and it is simply true: the ideal dataset is not always available. Detailed cadastral or parcel-ownership data, for example, is not published openly in many jurisdictions. A good analyst does not pretend otherwise — they pivot to a methodologically sound alternative (deriving parcels from other layers, using a coarser tenure proxy, or narrowing the study area to where authoritative data exists) and they tell you the trade-off up front. Our write-up on GIS parcel screening for developers shows how that pivot plays out in practice.
Commercial data belongs in this stage as an honest line item. Paid layers sometimes buy you resolution or currency you genuinely cannot get for free — high-resolution imagery, recent building footprints, verified points of interest. Just as often, an open alternative does the job. The right question is never "open or paid?" in the abstract; it is "does this specific criterion need paid data to answer the decision, or does an open layer suffice?"
Stage 3 — Method selection
Different questions call for different engines, and most real projects combine two or three:
- MCDA for weighing and combining criteria into a suitability surface — the backbone of siting and screening work.
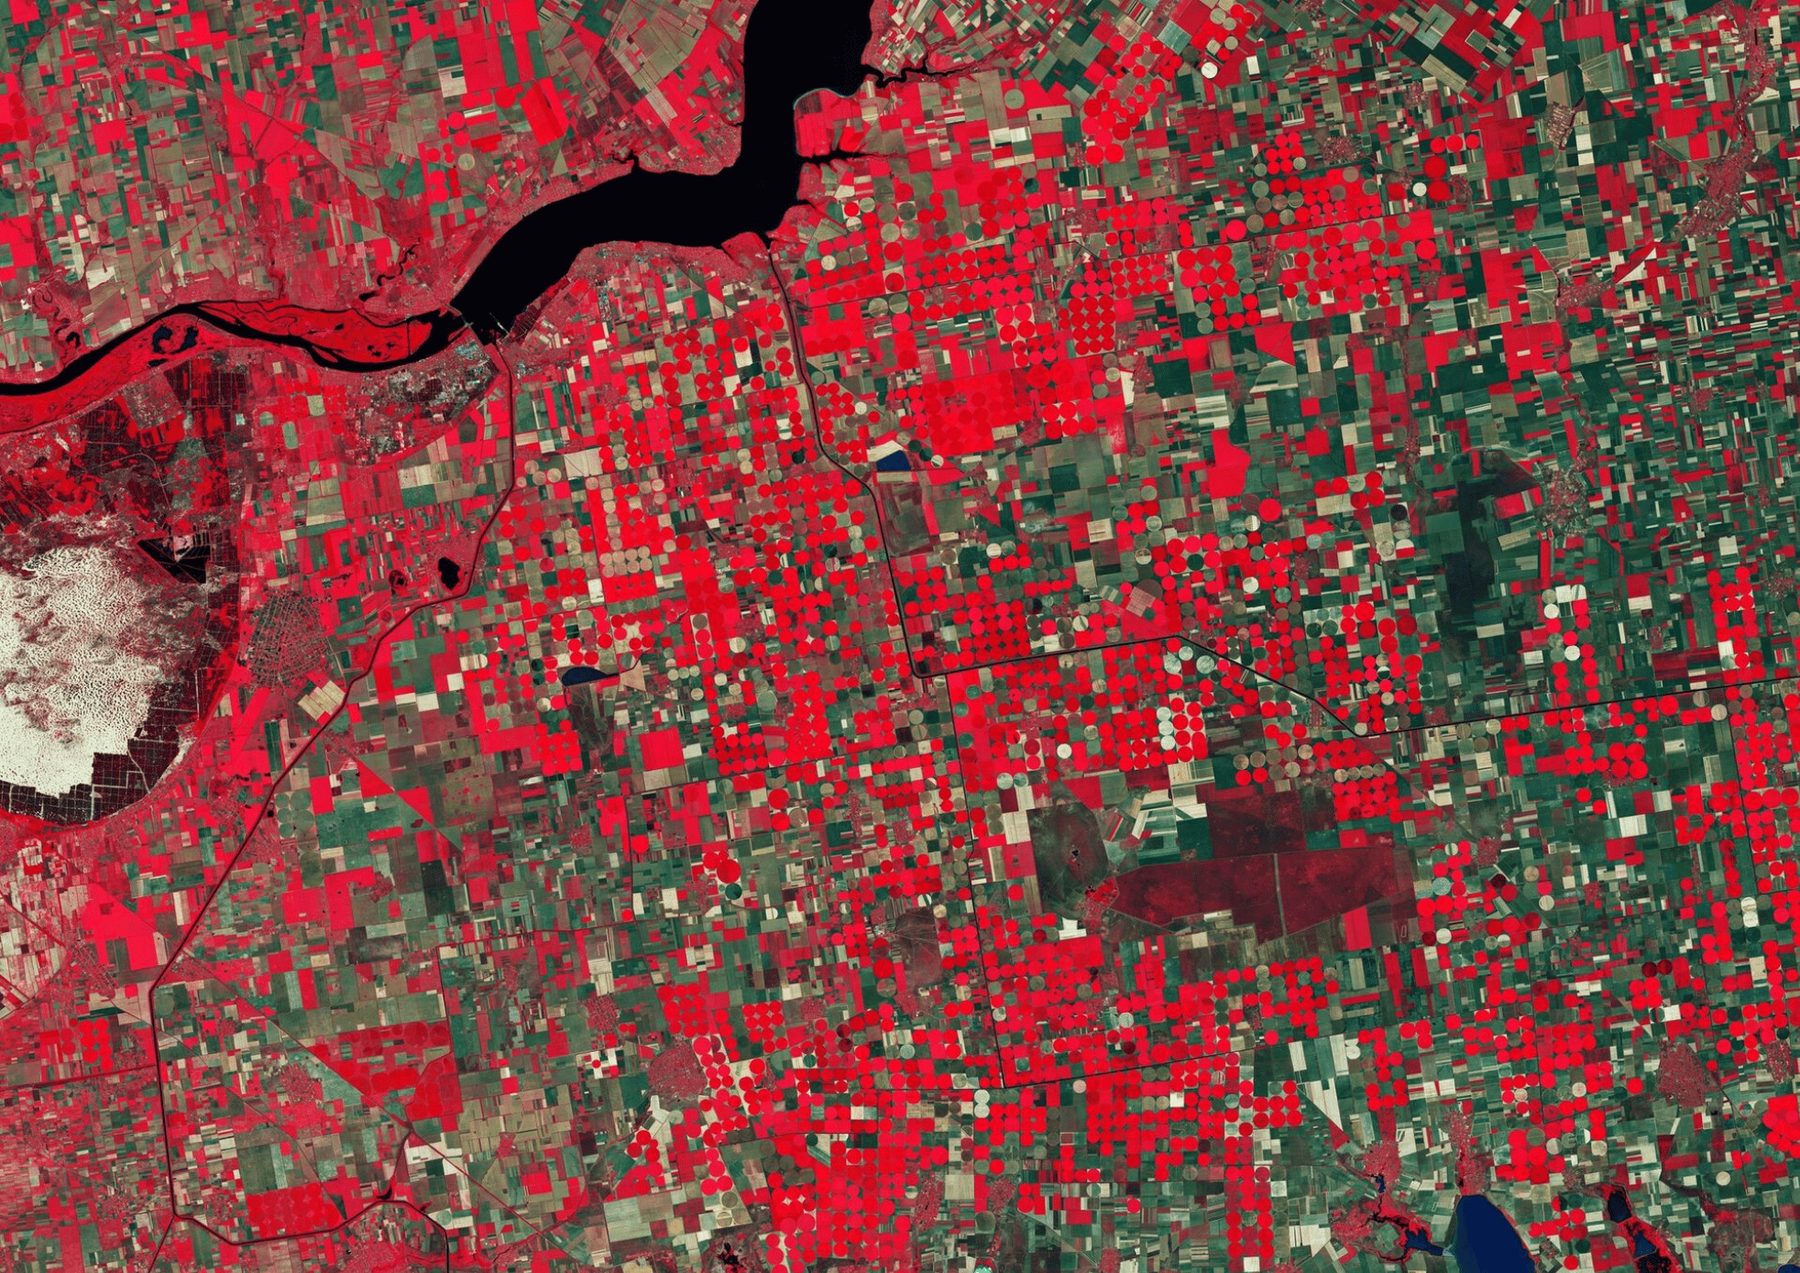
- Remote sensing when the answer depends on what the land actually is or how it has changed — land cover, vegetation, water, or built-up expansion derived from satellite imagery.
- Network analysis when distance means travel time along a real road or grid network rather than a straight line — the basis of trade-area and drive-time analysis.
Method selection is a design decision, not a default. It should follow from the question and the data, and a competent analyst can explain why one approach was chosen over the alternatives.
Stage 4 — Analysis, quality and accuracy
The analysis itself is where criteria are normalised, weighted, combined and ranked. But the step that separates a credible result from a coloured picture is quality and accuracy assessment: sensitivity checks on the weights, validation against known ground truth where it exists, and honest documentation of uncertainty. A suitability map with no discussion of how sensitive it is to its assumptions is a decoration, not a decision tool. When a project leans on satellite classification, accuracy assessment becomes a formal step in its own right — for machine-learning-based classification especially, a quantified accuracy assessment is what makes the output defensible.
Stage 5 — Delivery
A good engagement delivers three things, not one:
- The map — the ranked surface or shortlist, styled to be read by a decision-maker rather than a GIS specialist.
- The methodology report — the criteria, weights, data sources, method and caveats, written so the result can be defended to a board, a regulator or a lender.
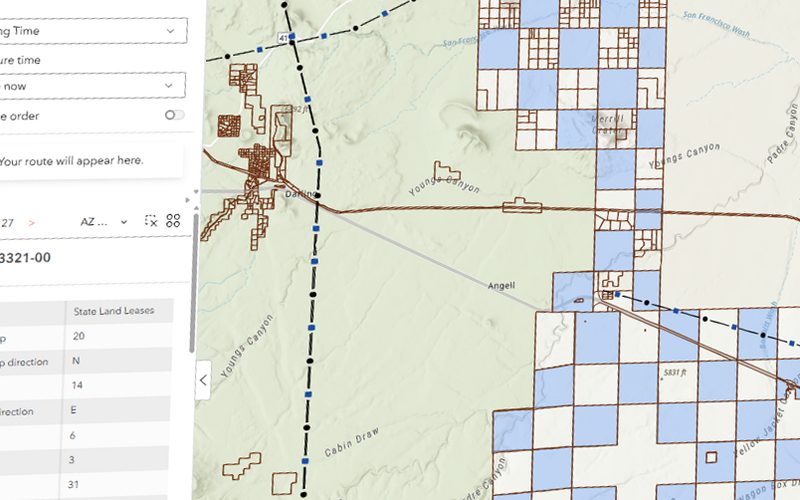
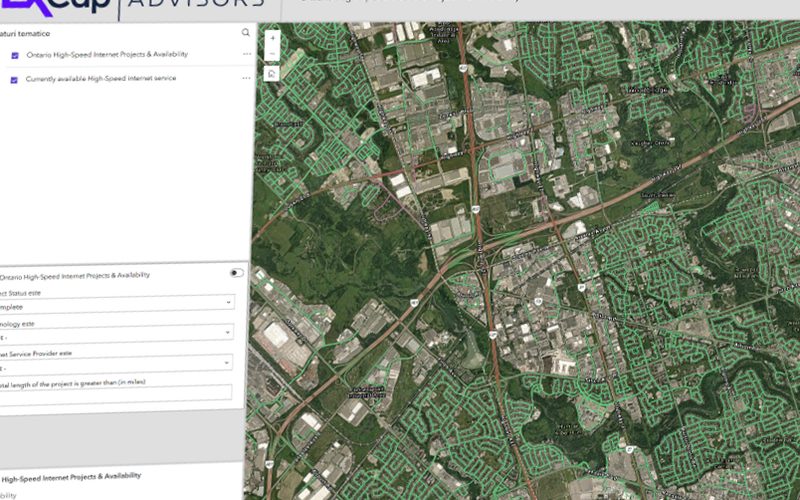
- The interactive web map — a live tool that lets stakeholders pan, zoom, toggle layers and query results themselves, rather than squinting at a static export.
That last one matters more than it sounds. A static PDF answers the question you asked; an interactive map lets people ask the next one. Building these interactive tools is a core part of how Cartolytic delivers.
What actually drives cost and timeline
Price and duration are not arbitrary. They track a short list of concrete factors, and understanding them lets you shape the budget instead of just reacting to a quote:
- Study-area size — more area means more data, more processing and more to validate.
- Data availability and licensing — open layers are cheap to source; commercial licences and any data-sharing constraints add cost and lead time.
- Number of criteria — each criterion is a layer to source, prepare and justify.
- Resolution — finer resolution multiplies data volume and compute.
- Custom data collection — anything that must be created from scratch (digitising, field data, bespoke classification) is the biggest swing factor.
- Revision rounds — agreed up front, they are cheap; discovered late, they are not.
What to prepare before you hire
You will get a faster, cheaper and better result if you arrive with these ready:
- A clear objective — the decision you are trying to make.
- An area boundary — even a rough polygon or a named region.
- Any existing data you hold, however messy.
- A decision timeline — when you need the answer.
- Your internal process — whether an approval step or a formal proposal is required before work can start.
Scope your project before you commit
Because the same five factors drive every engagement, it is possible to get a rough sense of a project's complexity before talking to anyone. A lightweight "scope your project" tool does exactly this: you pick the analysis type, the study-area size and how available the underlying data is, and it returns an indicative complexity band — a signal, not a quote. Cartolytic builds interactive tools like this so prospective clients can self-qualify and arrive at a conversation already knowing roughly where their project sits. It is the same interactive-mapping capability we deploy in the deliverables themselves, pointed at the scoping problem.
Data sources
A recurring question is what data a project needs and who pays for it. Most suitability layers can be sourced from open, authoritative datasets at no data cost — these are what we can source for you as part of the engagement. Commercial data is a deliberate line item, chosen only when resolution or currency justifies it.
Open & public
- Copernicus / Sentinel satellite imagery (ESA)
- Landsat imagery (USGS / NASA)
- Copernicus and SRTM elevation models (DEM)
- OpenStreetMap (roads, buildings, points of interest)
- National open-data and cadastral portals, where published
Commercial
- High-resolution satellite and aerial imagery
- Commercial building footprints and points-of-interest databases
- Licensed cadastral and parcel-ownership data, where not openly available
Tools & methods
- MCDA for weighting and combining criteria
- Remote sensing for land cover and change detection
- Network analysis for travel-time and accessibility
- Interactive web mapping for delivery
Ready to scope yours?
If you have a decision, a boundary and a deadline, the hard part is already behind you. Bring the five things above and we will turn them into a defensible answer — then get in touch to scope your own.