

Flood and climate risk is one of the largest liabilities that never appears on a balance sheet until it is too late. A building can sit just outside a designated flood zone and still flood; a portfolio can look diversified geographically while sharing a single climate exposure. For property owners, lenders and insurers, the question is no longer whether an asset is in a mapped zone — it is how much loss to expect, how often, and how that number moves as the climate warms. GIS is the discipline that turns scattered hazard data into a number you can price.
Two layers of the same problem
Serious flood and climate risk work separates two distinct questions that are often confused.
- Known, regulatory hazard. Is the asset inside an officially designated flood zone? This is a binary, compliance-driven view — the one that shows up in statutory disclosures and drives mandatory insurance requirements. It is necessary, but it is a floor, not a ceiling.
- Forward-looking, probabilistic risk. What is the depth and frequency of flooding at this exact location today, and how does that shift under a warming climate? This is the question buyers, underwriters and credit committees increasingly care about, because official maps lag reality and rarely cover every hazard type.
The gap between the two is where invisible liability lives. An asset can be fully compliant on paper and still carry a materially high expected annual loss.
Cover every flood pathway, not just the river
Official maps tend to focus on fluvial flooding. Credible analysis covers all three physical pathways, because a property outside the river floodplain can still be inundated by rainfall or storm surge.
- Fluvial (river) flooding — rivers and streams overtopping their banks, the hazard most official maps already capture.
- Pluvial (surface-water) flooding — intense rainfall pooling and running off before it reaches a watercourse. This is frequently unmapped and is a leading cause of uninsured loss.
- Coastal flooding — storm surge and tidal inundation, compounded over time by sea-level rise.
From hazard layers to an expected-loss number
The analytical core is a sequence of well-established GIS techniques, each turning raw geospatial data into something a decision-maker can act on.
- Intersect assets with hazard layers. Overlay each asset's footprint on flood-hazard surfaces to establish exposure and the water depth it would experience at different return periods.
- Apply depth–damage functions. Translate flood depth into a percentage of value lost, then into expected annual loss — the single figure that connects a map to an insurance premium or a valuation haircut.
- Derive surface water from a DEM. Where no official map exists, compute flow direction and accumulation from a digital elevation model to model where pluvial water collects. This is the same terrain-analysis toolkit we use across multi-criteria decision analysis work.
- Time-slice with climate projections. Run the analysis under standard warming scenarios to see how depth and frequency shift over the asset's holding period, rather than assuming today's hazard is static.
One composite score across the whole portfolio
Flood is rarely the only physical climate hazard on an asset, and single-hazard analysis understates true exposure. The more valuable output combines several perils into a composite exposure score that can be run across an entire portfolio for rapid screening:
- Flood — fluvial, pluvial and coastal.
- Extreme heat.
- Wildfire, especially in the wildland–urban interface.
- Subsidence and ground instability.
- Sea-level rise on coastal holdings.
Scoring every asset on the same basis lets an owner rank a thousand properties by exposure in one pass, flag the worst offenders for detailed study, and defend the methodology to auditors. It is the same screening logic we apply to parcel selection for real-estate developers, extended from opportunity-finding into risk-avoidance.
Where the outputs actually go
These maps and scores are not academic. They feed directly into commercial decisions:
- Insurance pricing — expected annual loss underpins premiums and reinsurance treaties.
- Lending decisions — physical risk affects collateral value and loan-to-value over the term.
- Acquisition due diligence — a hazard flag can reprice or kill a deal before closing.
- Climate disclosure — regulators and investors increasingly demand quantified, location-specific physical risk reporting.
Because the same evidence base supports acquisition, valuation and disclosure, it repays the effort of building it once and reusing it — a theme we return to in our work on turning spatial analysis into decisions.
Making the invisible liability visible
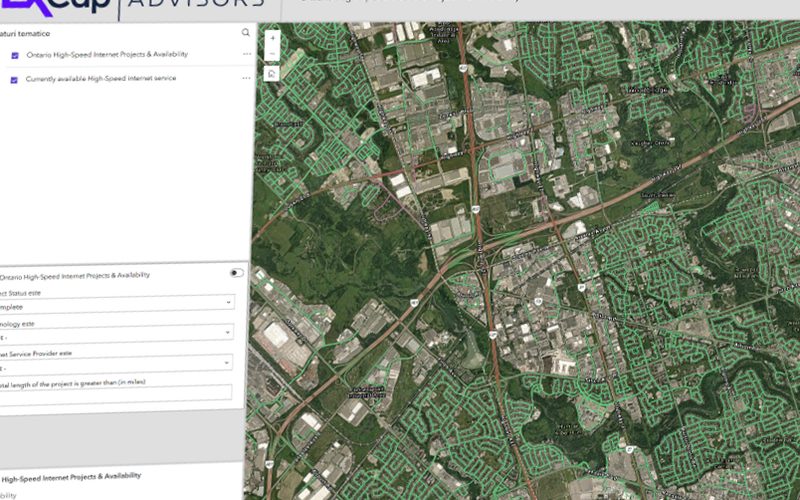
The most effective way to communicate this risk is not a spreadsheet — it is an interactive map. Cartolytic builds flood and climate overlay tools where a client can drop their portfolio pins onto live hazard layers and watch an expected-loss or exposure score update for each asset in real time. Instead of a static report, decision-makers explore the exposure themselves: pan across a region, toggle between return periods and climate scenarios, and see which holdings light up. That interactive framing is what turns an abstract, easy-to-ignore liability into something a board or an underwriter engages with directly. It is the same delivery model we describe in interactive web maps versus static reports.
Data sources
Robust flood and climate risk mapping blends open reference data with commercial models that offer higher resolution and property-level detail, assembled and scored with standard geospatial tooling.
Open & public
- FEMA National Flood Hazard Layer (NFHL) — US flood zones.
- JRC Global Flood Hazard and Global Surface Water.
- Copernicus Emergency Management Service.
- NOAA — coastal hazards and sea-level rise.
- USGS — elevation and landslide data.
- LANDFIRE and EFFIS — wildfire fuels and fire history.
- World Bank ThinkHazard.
Commercial
- Fathom — global fluvial, pluvial and coastal flood.
- First Street Foundation — US property-level flood, fire, heat and wind.
- JBA Risk Management.
- Jupiter Intelligence, XDI and Cervest — physical climate risk.
- Moody's RMS and Munich Re — catastrophe and climate modelling.
Tools
- QGIS with PostGIS/PostgreSQL — spatial overlay and portfolio-scale scoring.
- GDAL and rasterio — raster hazard processing and DEM handling.
- WhiteboxTools and SAGA GIS — hydrological terrain analysis for flow direction and accumulation.
- MapLibre GL — interactive web overlays for portfolio exploration.
Scoping a flood and climate engagement
Every portfolio is different: the hazards that matter, the geographies in scope, the resolution the decision demands, and whether open data is sufficient or a commercial model is warranted all shape the work. We treat that definition step as its own deliverable, so that the analysis you commission answers the exact question your underwriters, lenders or auditors are asking, and nothing you pay for goes unused.