
Inputs
Imagery
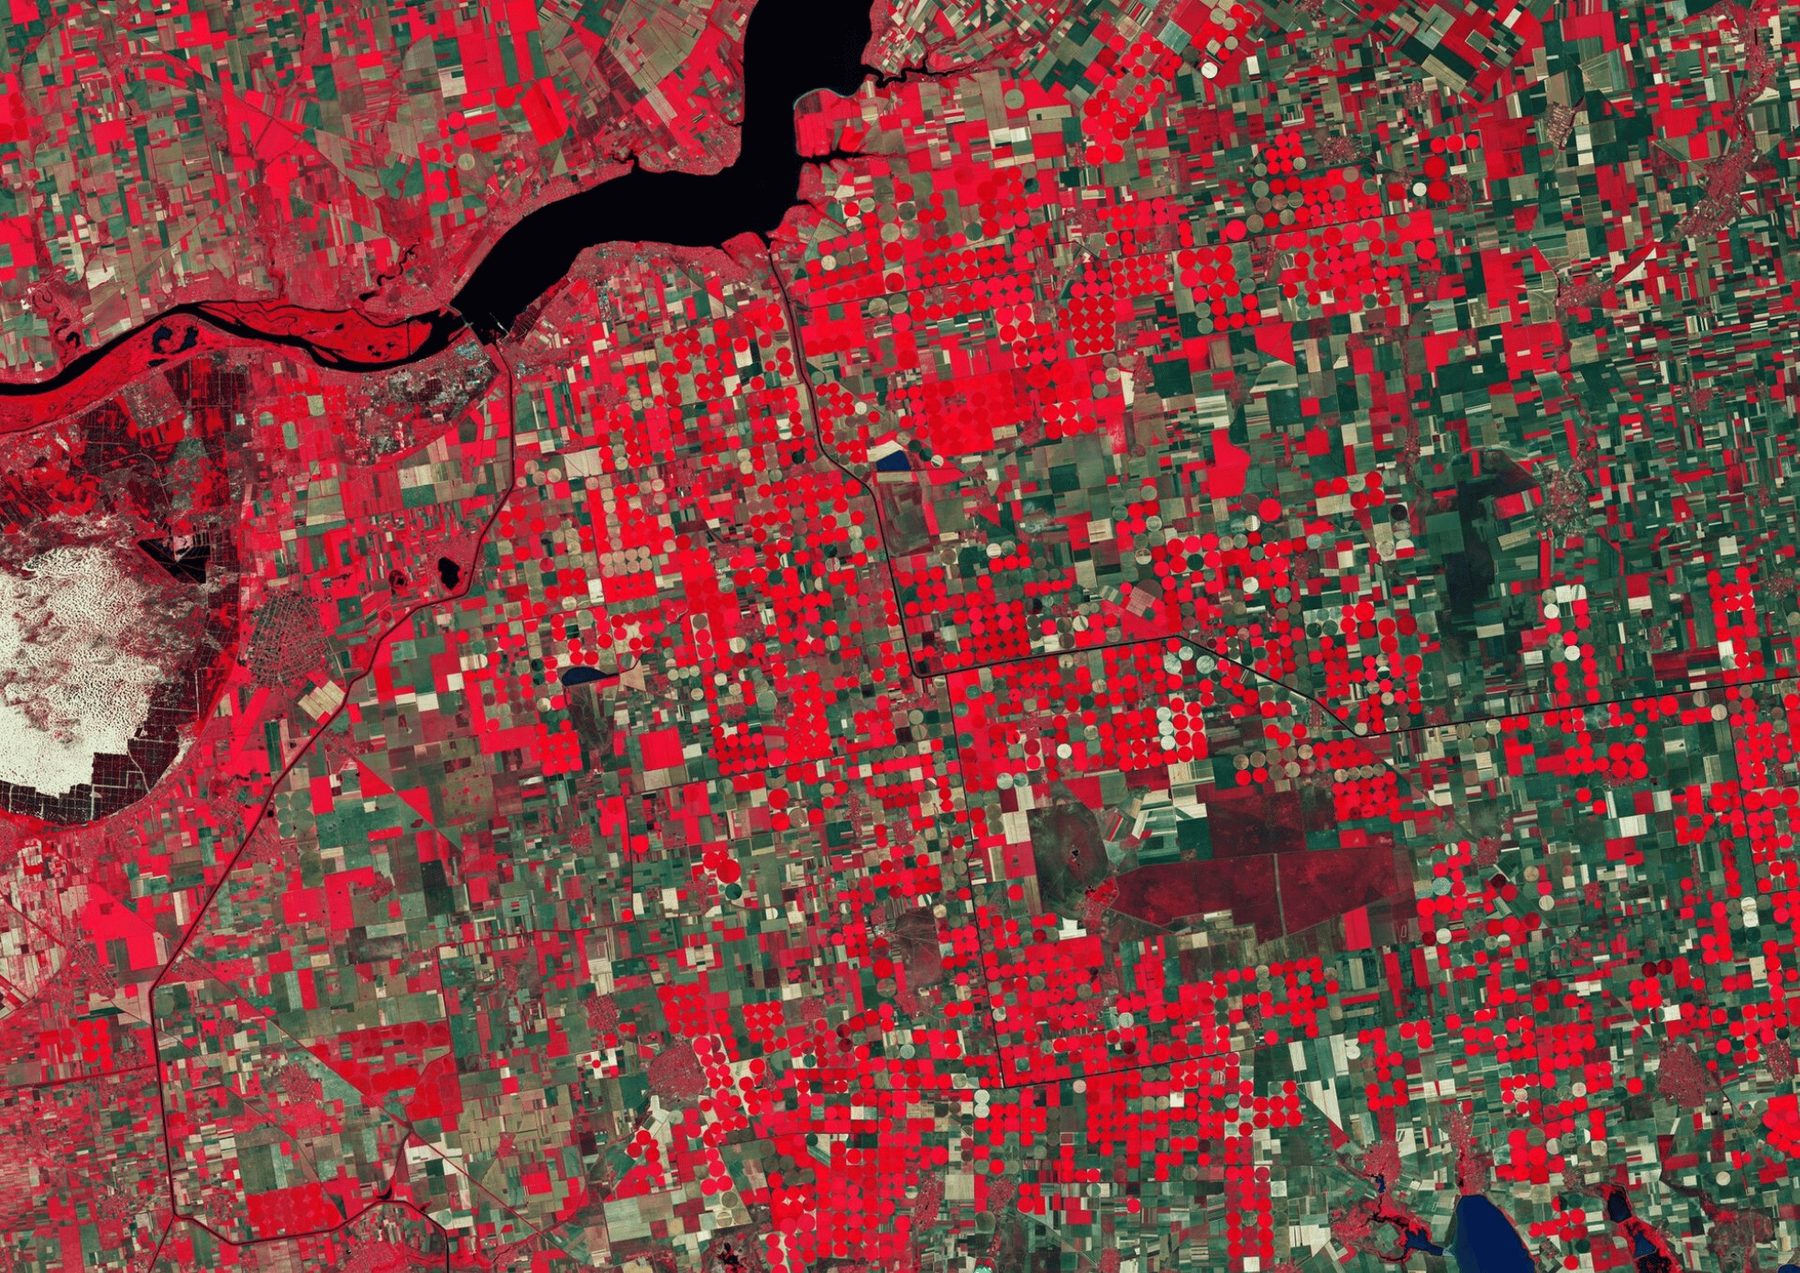
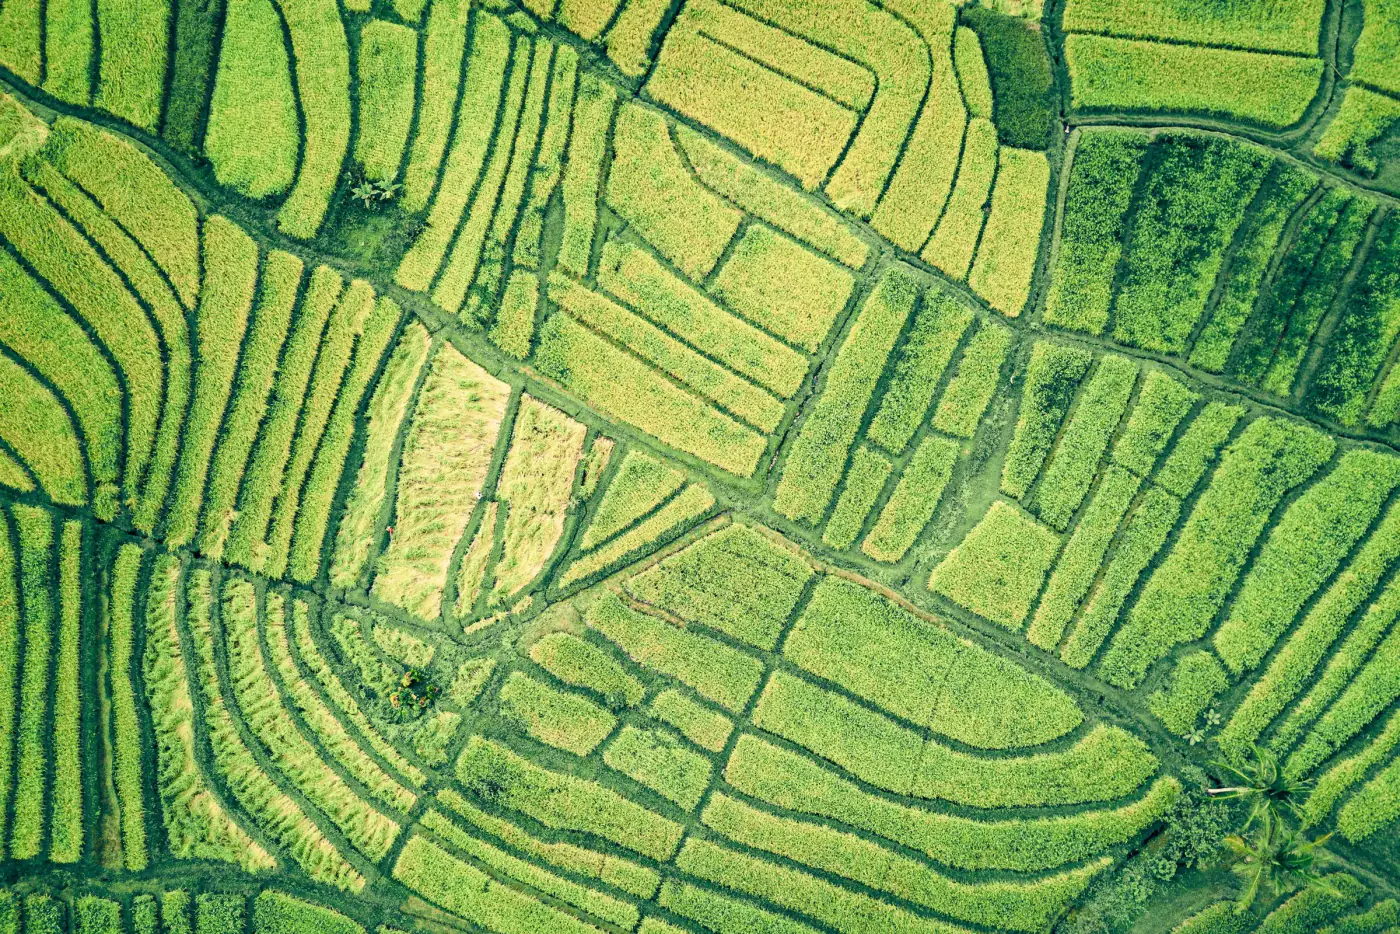
Sentinel-2 open data at 10 m covers whole regions through the season; very-high-resolution imagery or drone surveys add detail for orchards and small plots. Scenes are cloud-masked and stacked into a time series for each field.
Home/Solutions/Crop and vegetation monitoring
What is growing, and where is it stressed?
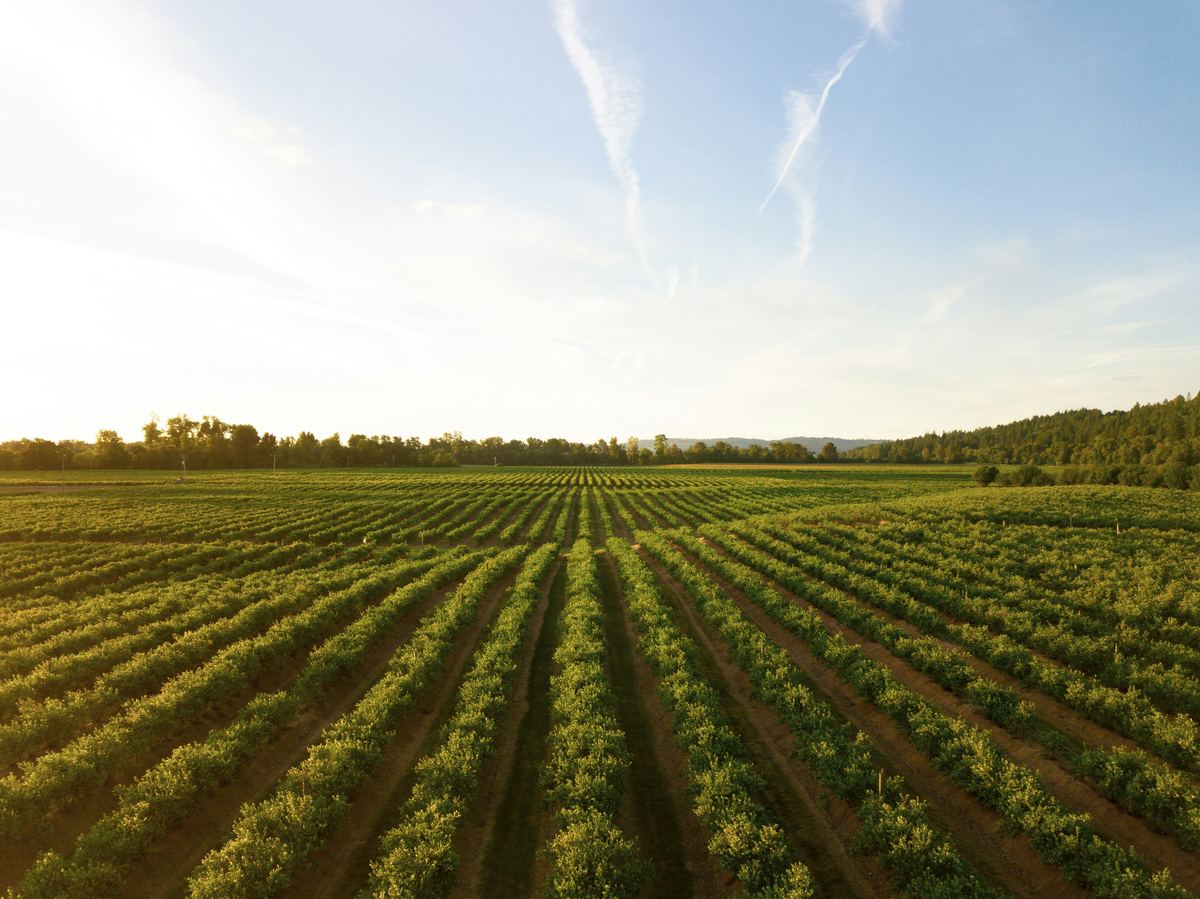
Crop monitoring from satellite imagery tells you what grows in each field and where it is under stress, without walking every row. We use Sentinel-2 time series and vegetation indices such as NDVI to map crop types, follow crop health through the season and outline zones within fields; the same methods map the grass between the panel rows of a solar park.
A field changes colour through the season in a way that is typical of its crop. Read over months, those curves identify the crop; read week to week, a drop in vigour points to stress before it is plain from the edge of the field. Rice fields, for example, show a flooding pattern of their own, which is what we used to map them in California's Sacramento Valley.
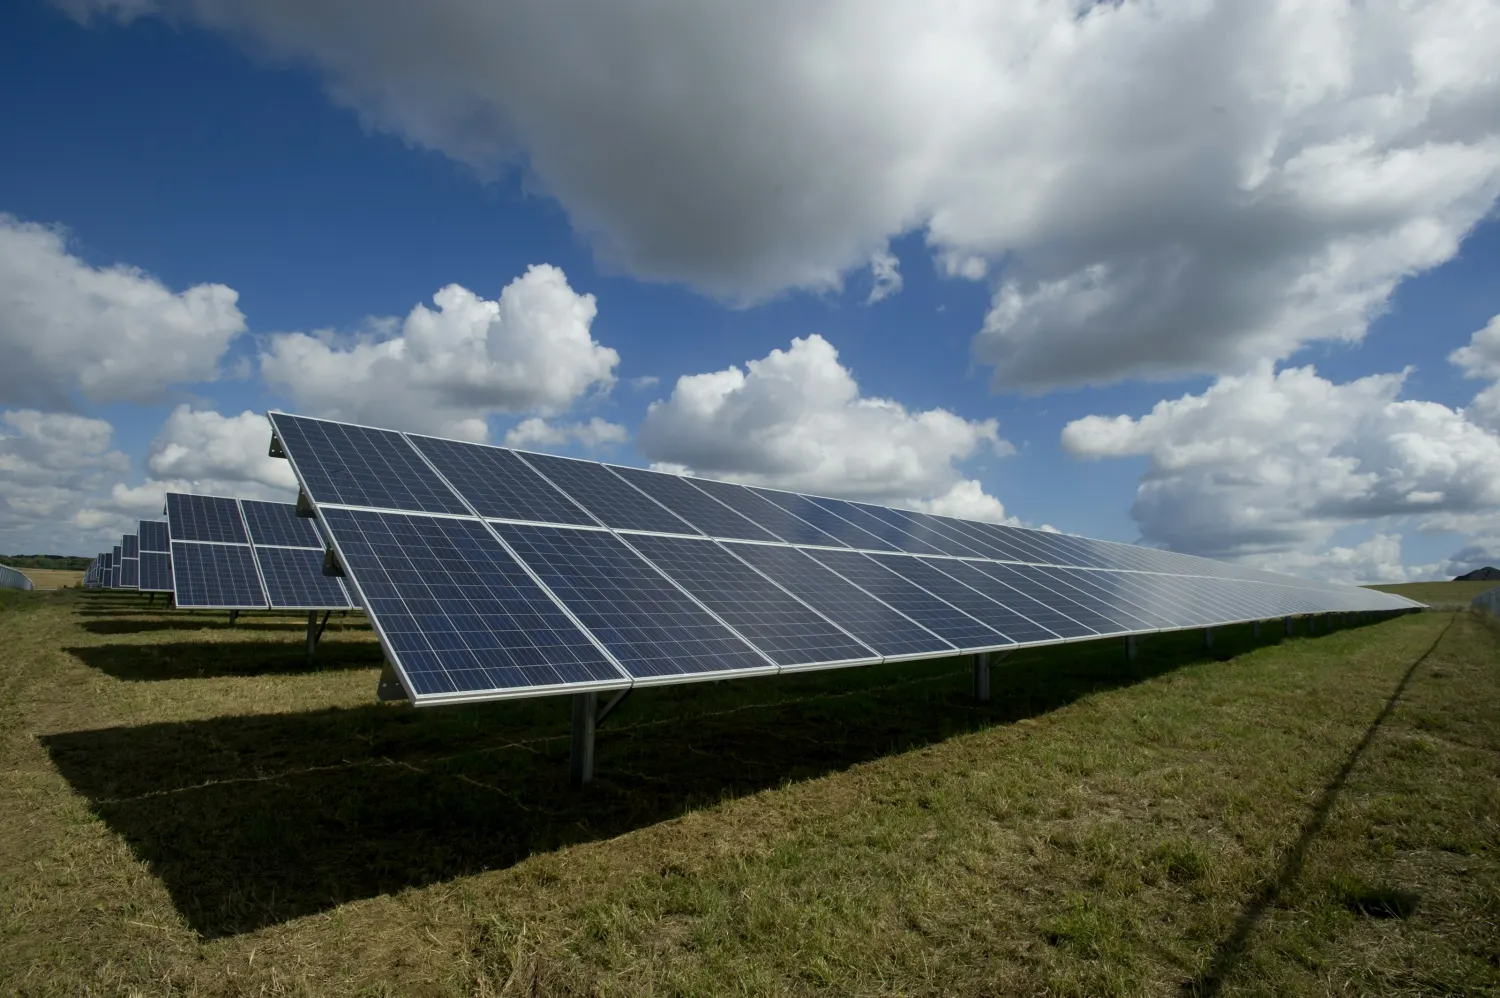
Vegetation is not only a farm question. On a running solar park, grass between the rows can grow into the panels and has to be cut; mapped from imagery, it shows the mowing crews where they are needed.
Inputs
Sentinel-2 open data at 10 m covers whole regions through the season; very-high-resolution imagery or drone surveys add detail for orchards and small plots. Scenes are cloud-masked and stacked into a time series for each field.
Analysis
For crop health we compute indices such as NDVI for every date; for crop type, a classifier learns the seasonal curve of each crop from fields you know and labels the rest.
Result
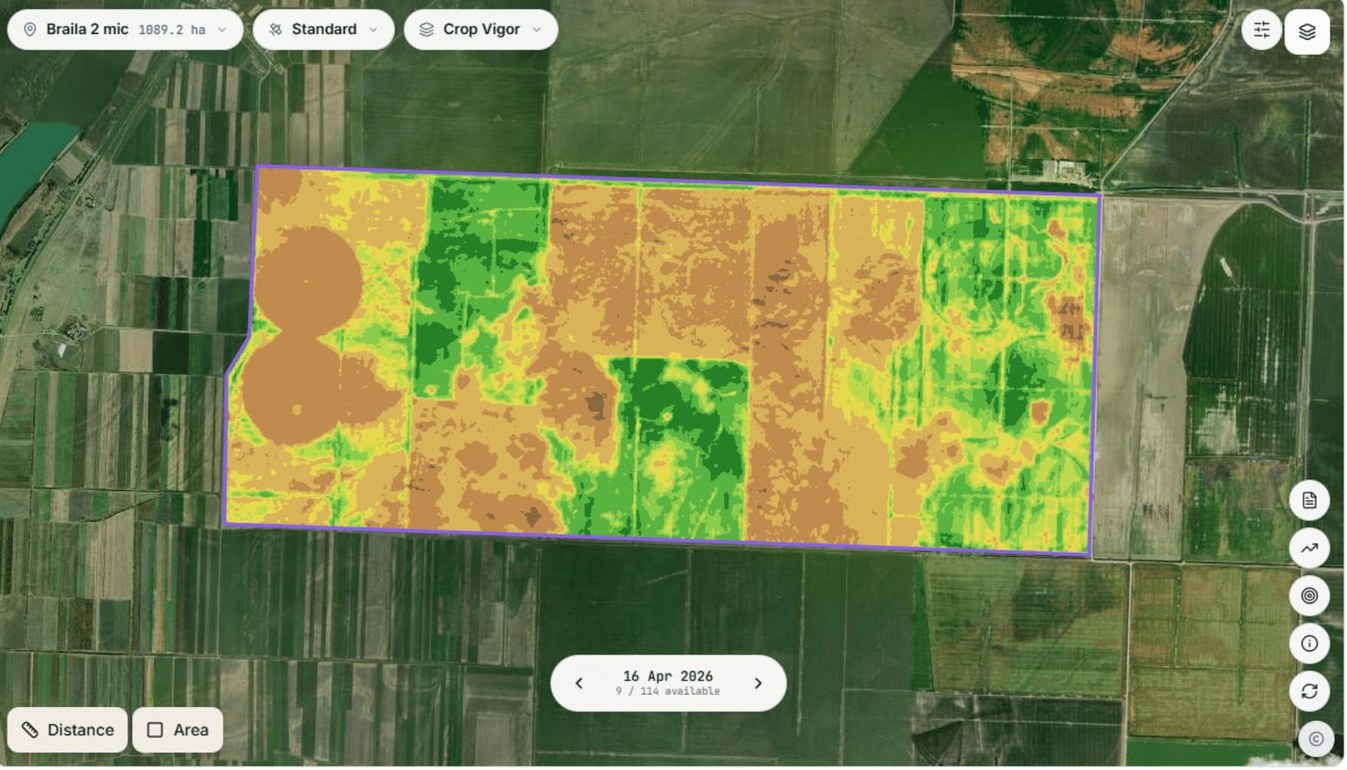
Results are summarised per field: crop type, area, and zones of higher and lower vigour to guide scouting. A change from one date to the next flags the fields that need a look.
Each field labelled with its crop, with the total area of each crop.
NDVI by date, field by field, through the season.
Areas of higher and lower vigour inside each field.
One row per field: crop, area and index values by date.
Rasters and vectors such as GeoTIFF and shapefile, plus a spreadsheet.
Limits
Clouds can leave gaps of weeks in a season, and 10 m pixels blur small fields and field edges; an index shows where vigour is low, not why, so the cause is checked on the ground.
Satellites such as Sentinel-2 photograph the same fields through the season. Vegetation indices like NDVI turn each image into a measure of how green and dense the crop is, field by field, and the time series shows where it grows well and where it falls behind.
Yes. A classifier learns how each crop changes through the season from fields you already know, then labels the others. Some crops are easy to tell apart: in California's Sacramento Valley we mapped the rice fields from their flooding pattern in Sentinel-2 time series. Crops with similar seasons need more reference fields.
Yes. We mapped the grass between the panel rows of a solar farm from satellite imagery, to show where mowing was needed.
It is a good first signal, not a diagnosis. Low NDVI can mean drought, disease, poor emergence or simply later sowing. We map where vigour is low; an agronomist on the ground finds out why.
Yes. They can sit in a web map your team opens on any phone, or inside a field app. AGROGIS, the platform we developed for agrogis.ro, works this way on web, Android and iPhone.
Tell us the area, the decision and the deadline. We reply within 24 hours, from the person who will deliver the work.
Based in Bucharest, working with clients on five continents.