
Inputs
Hazard
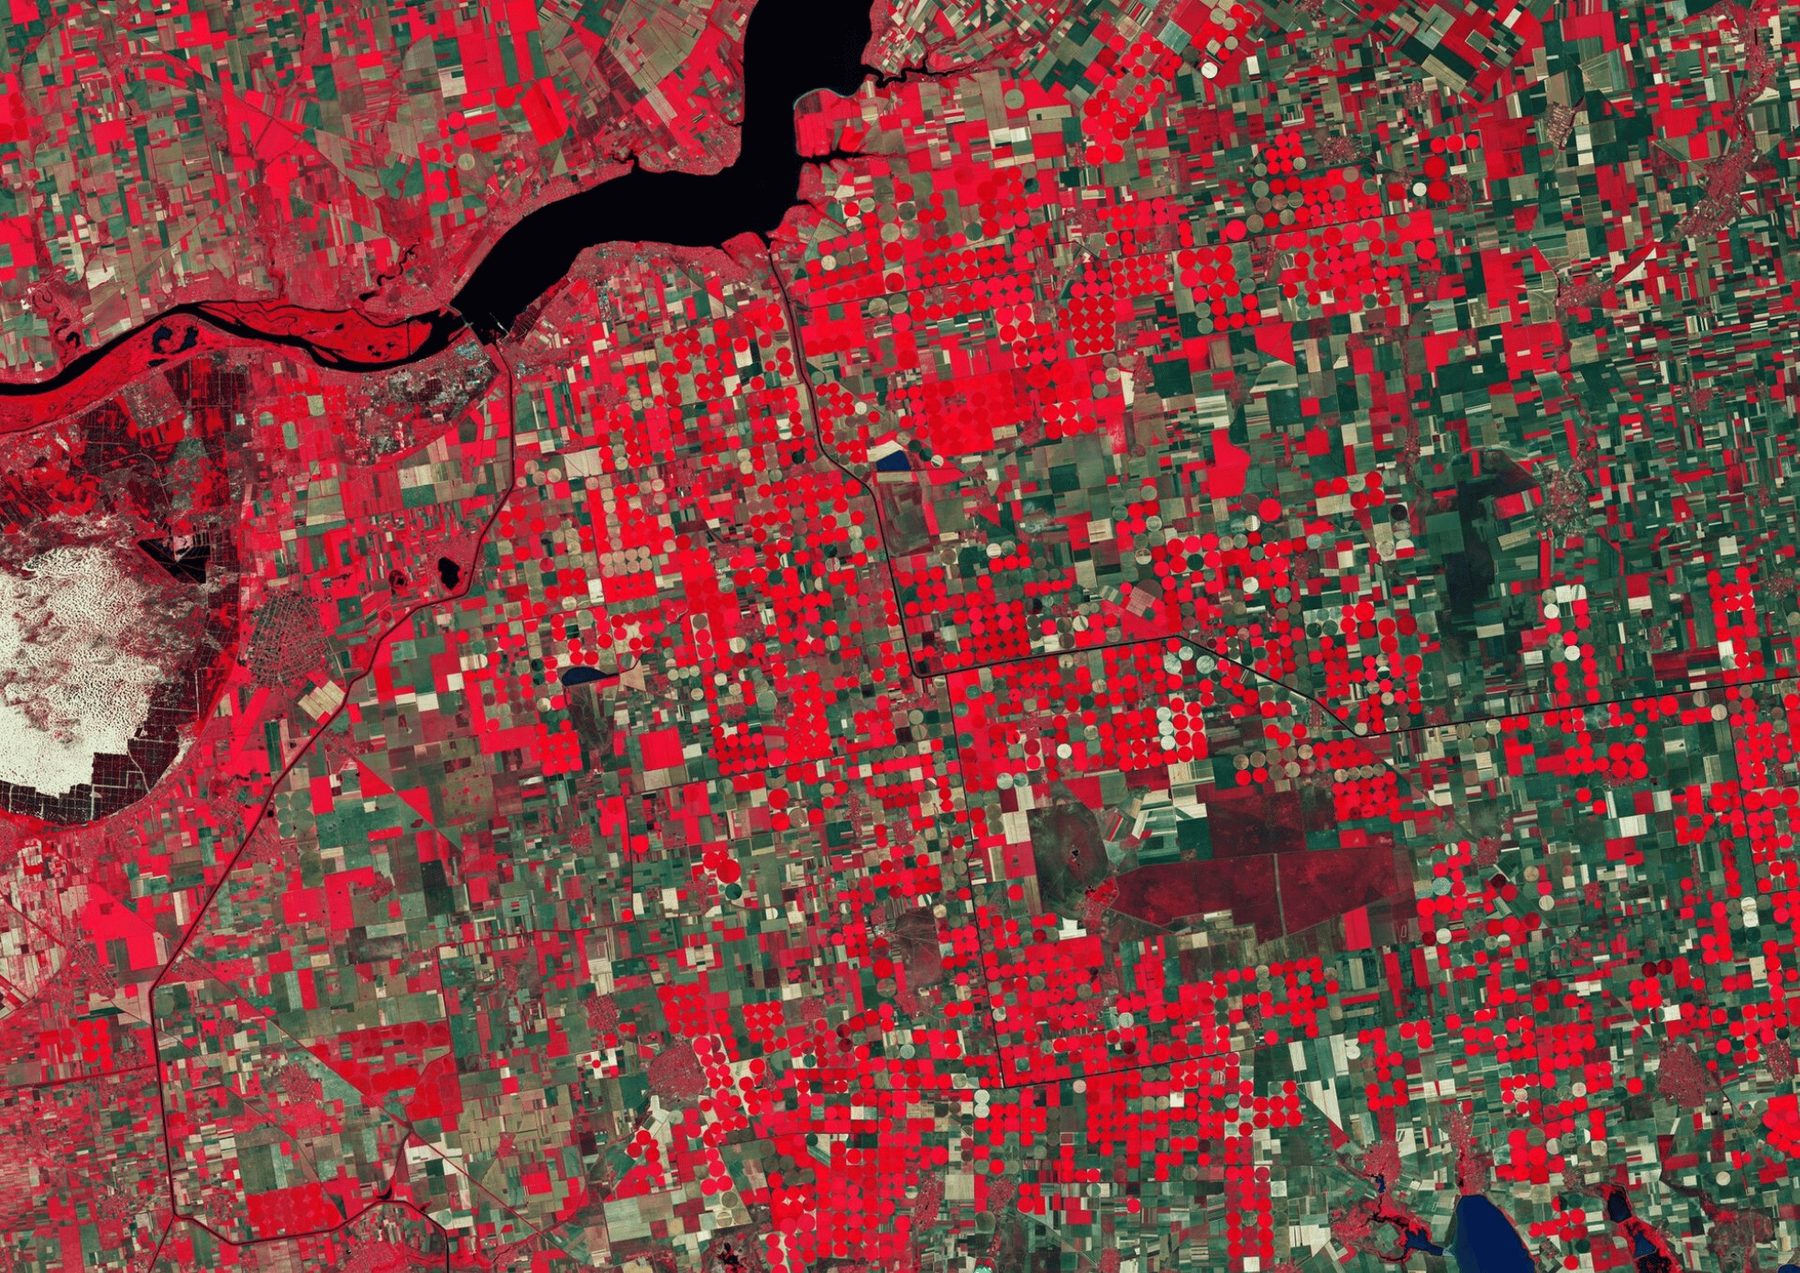
Official flood zones, or the factors that drive flooding: elevation and slope from an elevation model, distance to rivers and land use. For heat, land surface temperature from satellite imagery of the hottest days.
Home/Solutions/Flood, heat and environmental exposure
What is exposed to the hazard?
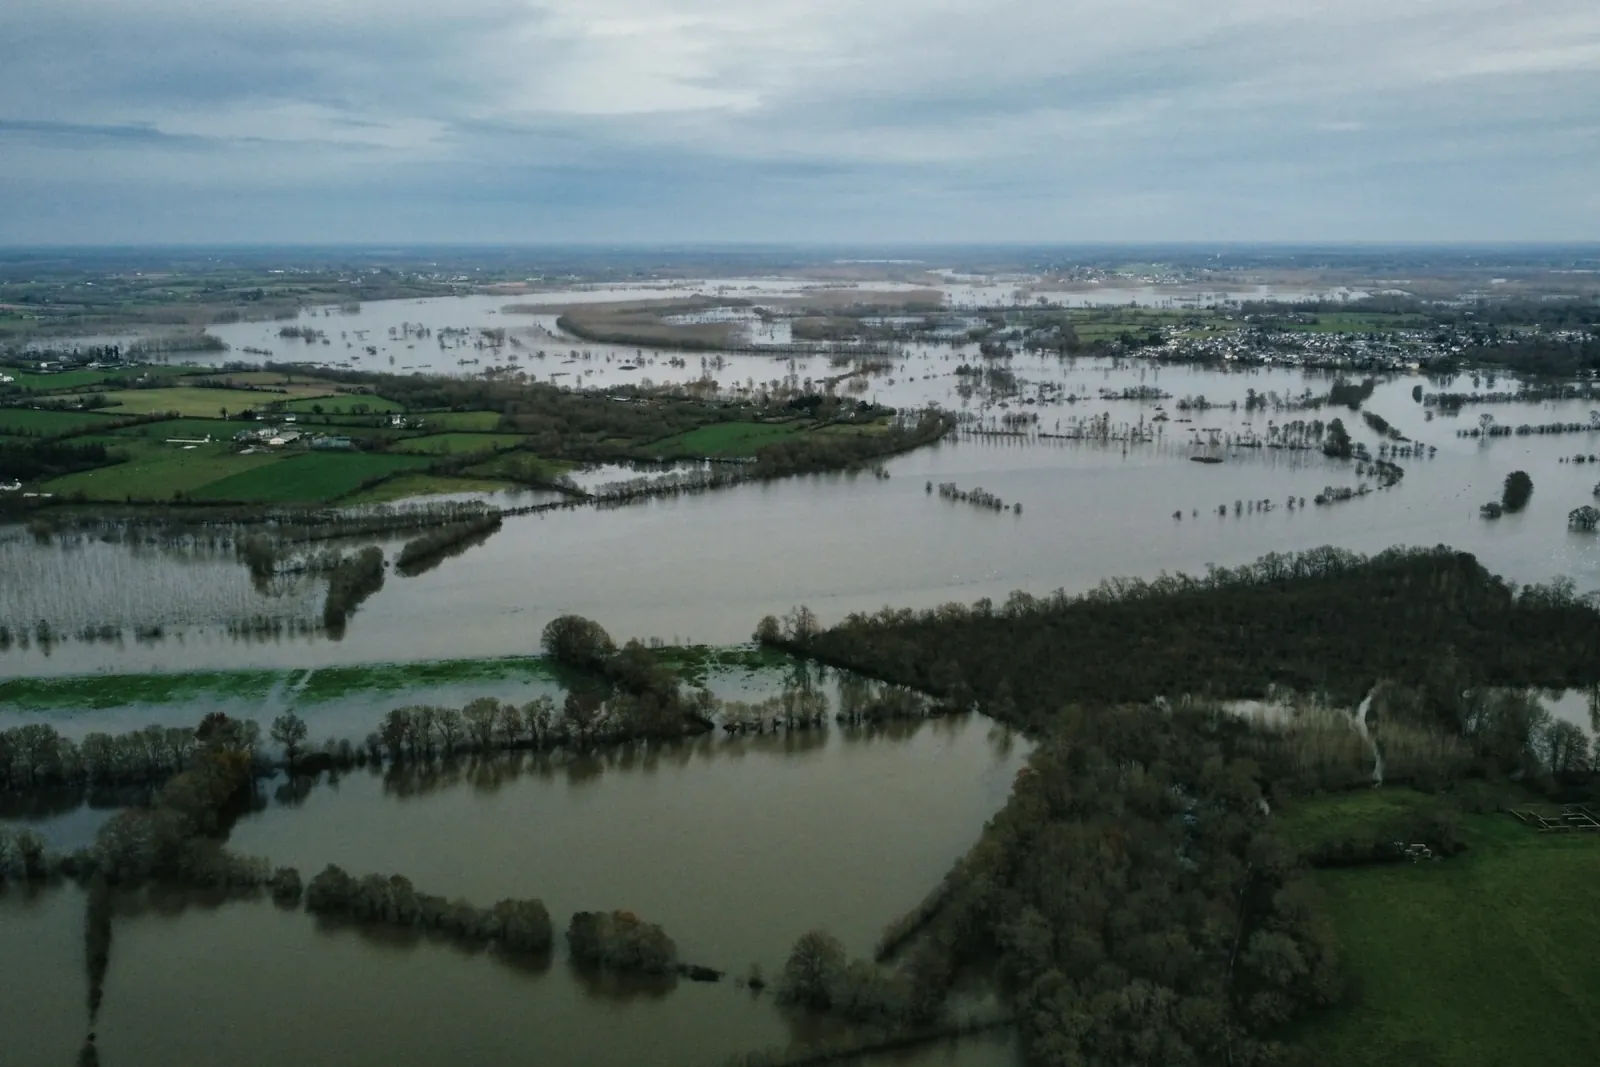
Flood risk mapping with GIS answers the question a buyer, a lender or a town asks first: what is exposed, and how badly? We combine the hazard, from mapped flood zones or from terrain, rivers and land use, with what stands in its way, people, buildings and parcels, and classify the result into risk levels you can act on. Urban heat is mapped the same way, from satellite surface temperature.
Risk is not the hazard alone. A flood zone over an empty field is a small problem; the same water through a school or a row of homes is a large one. That is why we map exposure and vulnerability next to the hazard: who and what is in the way, and how well they can cope.
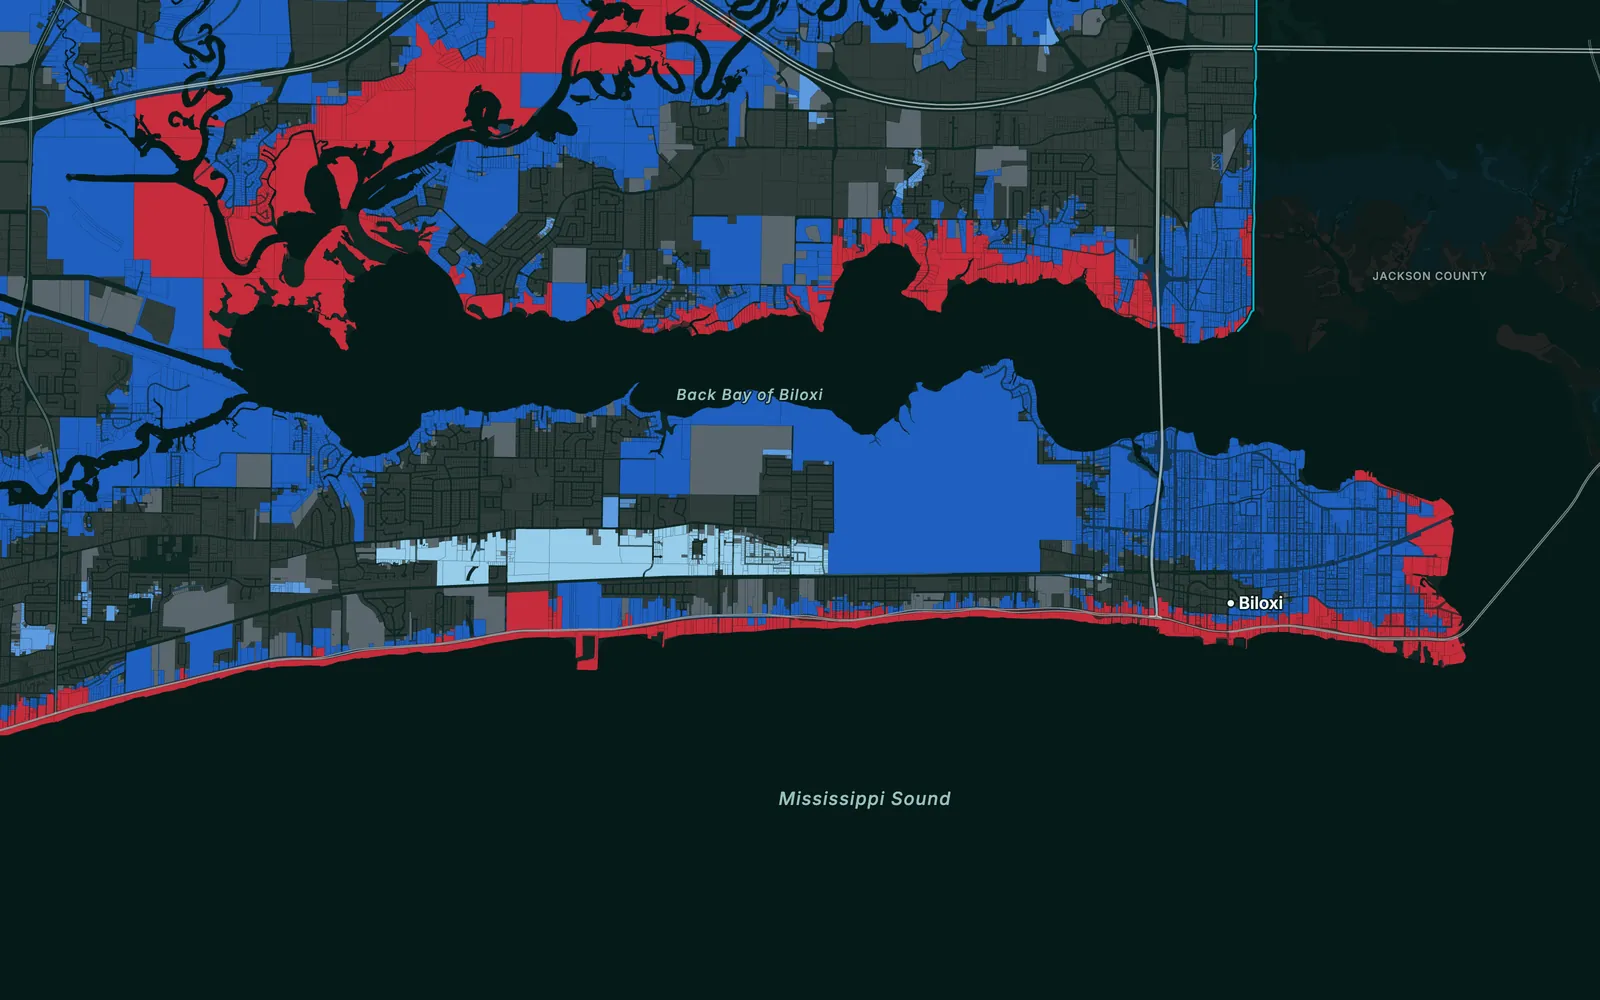
Where official flood maps exist, such as FEMA zones in the United States, we start from them. Where they do not, we model the hazard from elevation, slope, land use and hydrology, as we did in the town of Puerto Casado in Paraguay.
Inputs
Official flood zones, or the factors that drive flooding: elevation and slope from an elevation model, distance to rivers and land use. For heat, land surface temperature from satellite imagery of the hottest days.
Analysis
Buildings, parcels, population and services are overlaid on the hazard. Each factor is weighted, and vulnerability, such as population density or sensitive sites like schools, is scored beside it.
Result
Hazard and vulnerability combine into risk classes, five in Puerto Casado, and every parcel or building gets its class. A table counts what sits in each class, so priorities follow the numbers.
Flood zones or modelled susceptibility, in classes.
Hazard and vulnerability combined, from very low to very high.
Parcels, buildings or people in each class, by zone.
Surface temperature by neighbourhood, with the hottest blocks marked.
The risk layers online, with a pop-up for each parcel or building.
Limits
A screening map ranks relative risk from the data available; it is not an engineering flood model or an official flood zone, and it cannot predict a single event.
Which places, parcels and people are exposed to flooding, and how severely, in classes from low to high. It combines the hazard with what lies in its path, so two areas in the same flood zone can still rank differently.
Yes, where they exist and fit the question, such as FEMA flood zones in the United States. Where there are none, or they are out of date, we model flood susceptibility from terrain, rivers, land use and population, and say plainly that it is a model.
Yes. Satellite surface temperature from the hottest days shows which neighbourhoods heat up most, and vegetation data shows where trees and parks cool them. Together they point to where shade and green space are most needed.
Yes. Every parcel or building gets its hazard zone and risk class in one table, so a lender or owner sees the exposure of the whole portfolio at a glance and can open each site on a map.
No. An engineering study models water depths and flows for design. Our maps screen and rank exposure over large areas, so you know where an engineering study is needed first.
Tell us the area, the decision and the deadline. We reply within 24 hours, from the person who will deliver the work.
Based in Bucharest, working with clients on five continents.