
Before the next flood
Which streets and buildings are at risk?
Elevation, slope, land use, rivers and population weighted into flood risk classes, so the most exposed areas show first.
Home/Industries/Public Sector & Urban Planning
Flood risk, planning and open data for towns and their residents.
The types of analysis we run in this industry, each with its examples here.
All eleven typesThree questions a town asks of its maps.
Before the next flood
Elevation, slope, land use, rivers and population weighted into flood risk classes, so the most exposed areas show first.
For health and climate plans
Surface temperature and vegetation from satellite, mapped neighbourhood by neighbourhood.
For every resident
Travel times along the real road network to schools, clinics and stops, not straight-line circles.
The same work, in the form each person on your team needs.
An open web map or geoportal, published through our Web GIS service.
Open web maps
An open web map or geoportal, published through our Web GIS service.
Open web maps
An open web map or geoportal, published through our Web GIS service.
Every map here is our own work; the caption under it says what it shows.
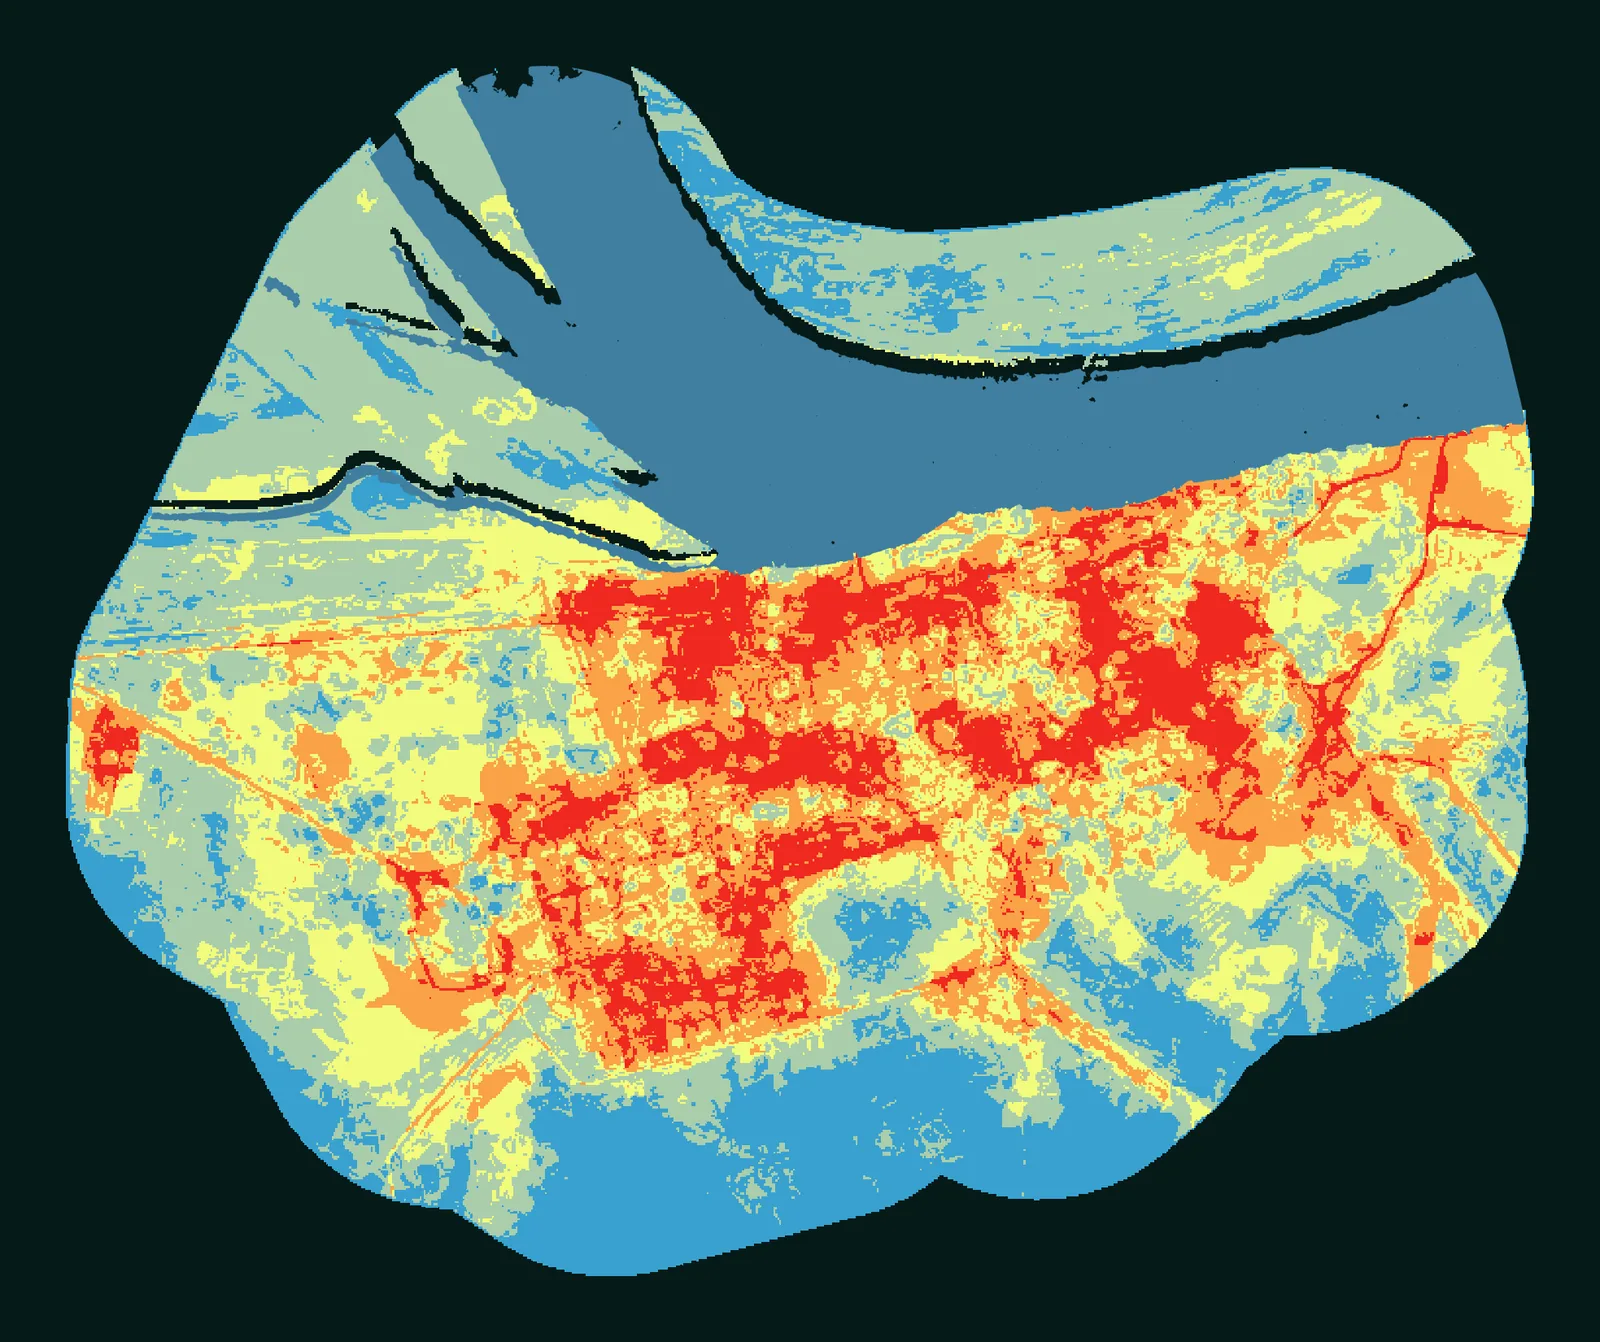
Flood risk, Puerto Casado, Paraguay, 2024
Flood risk (821 ha study area)
The projects we delivered in this industry: open one to see its page or its whole map.
All projectsYes. We weight factors such as elevation, slope, land use, hydrology and population density into hazard and risk classes. In a study of Puerto Casado, Paraguay, for a private client, we used 5 weighted factors and 5 risk classes.
Yes, from satellite surface temperature and vegetation data, neighbourhood by neighbourhood.
Yes, with travel times along the real road network to schools, clinics or stops, not straight-line circles.
Yes. We can publish them as an open web map or geoportal through our Web GIS service.
The same way of working, for other kinds of project.
 Carbon, Forests & EnvironmentCarbon projects, forest monitoring and MRV.
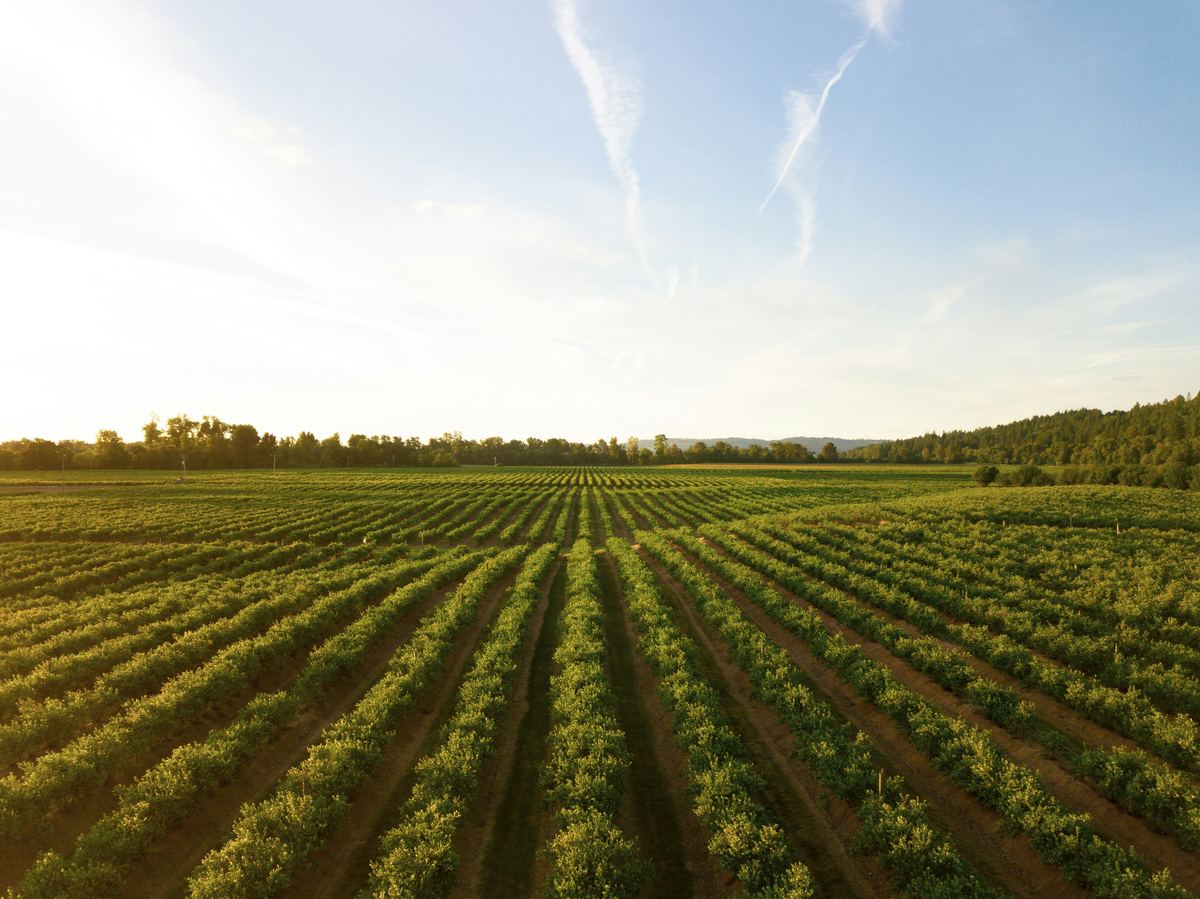 Agriculture & Land ManagementCrop monitoring, field analytics and land-use change.
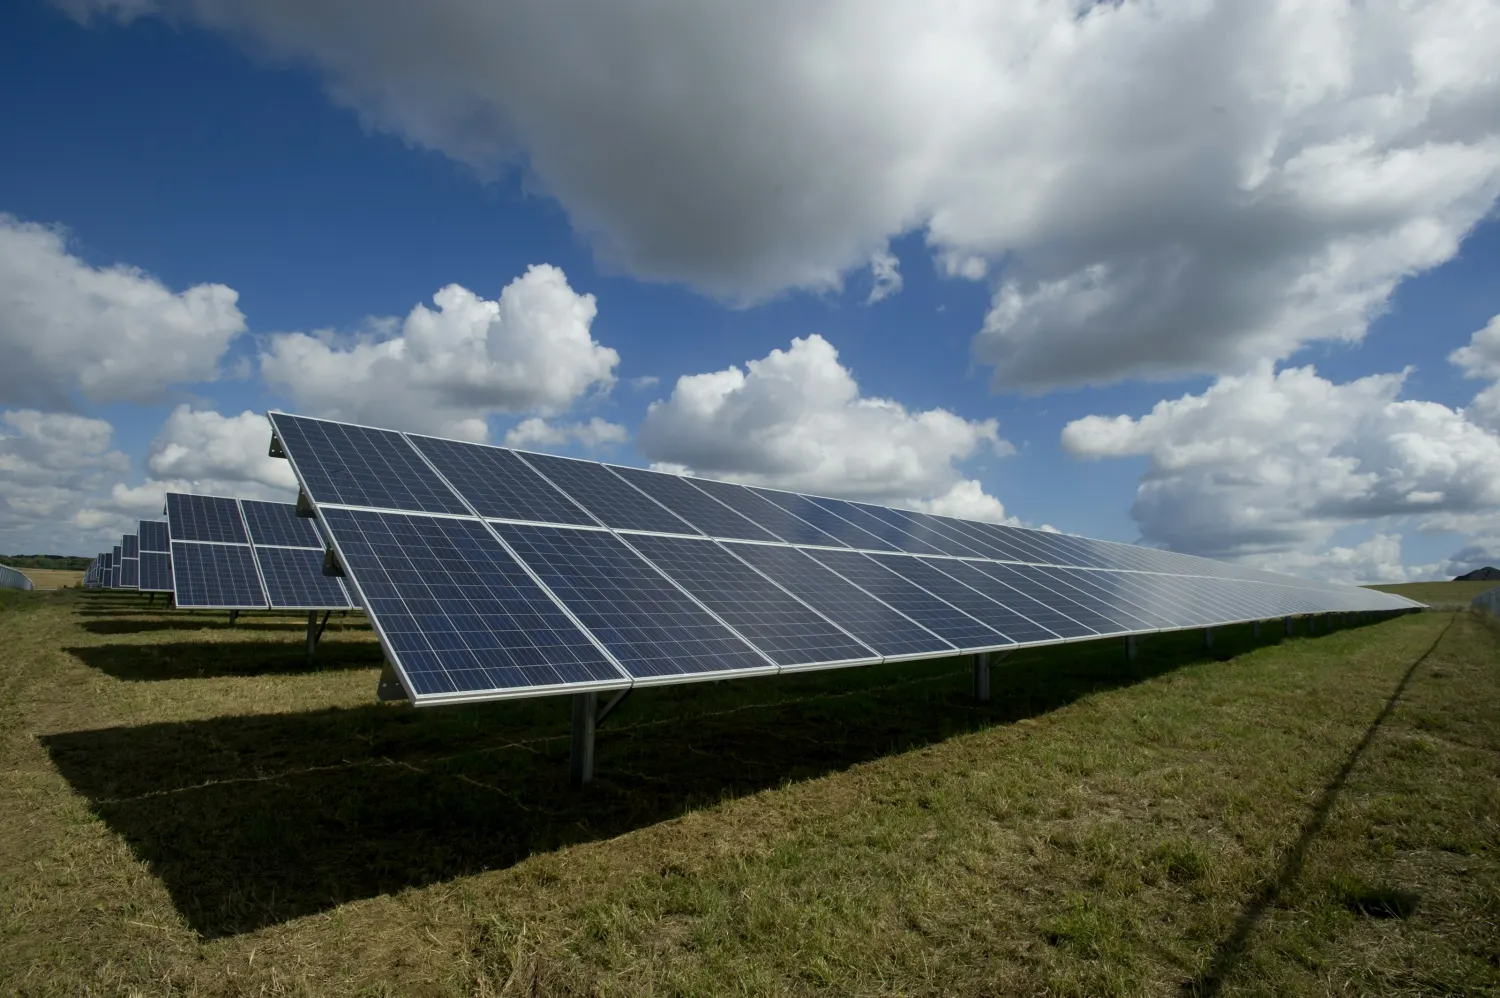 EnergySite selection and land screening for renewable energy.
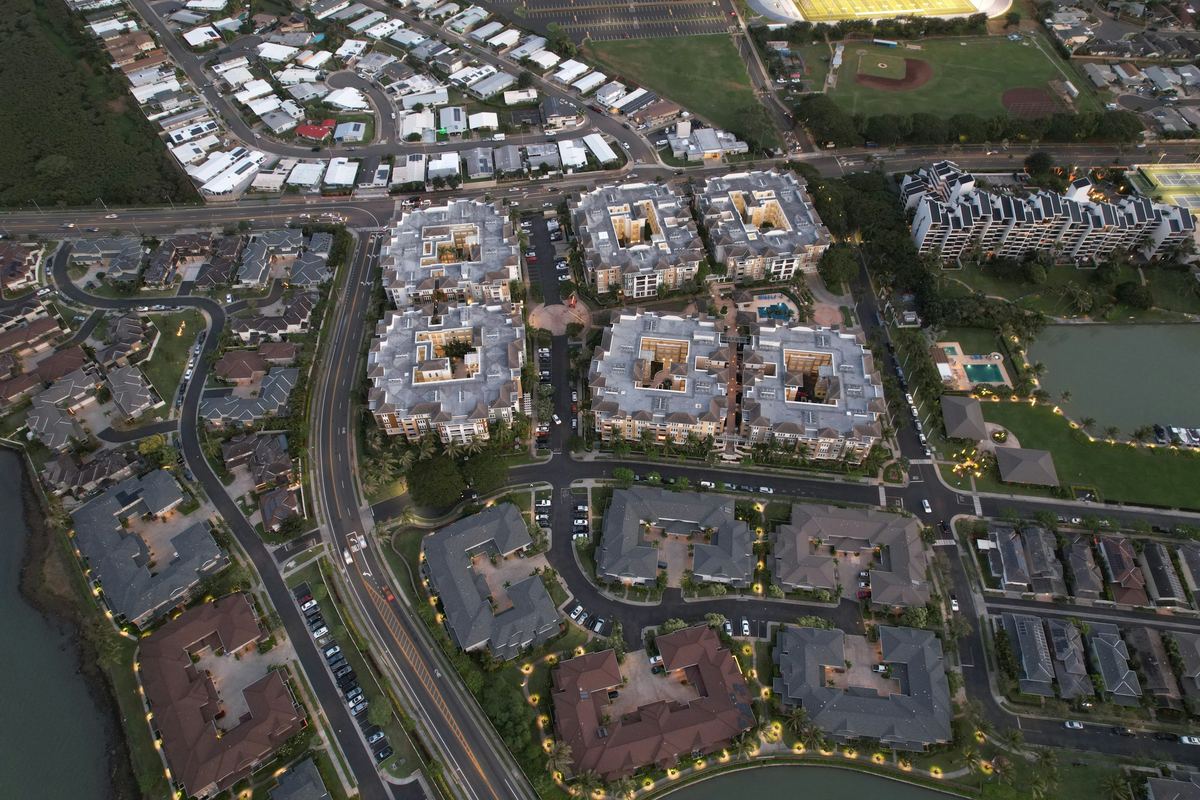 Real Estate & DevelopmentParcel screening, zoning and flood constraints.
 Retail & Market IntelligenceBest locations, trade areas and competitors.
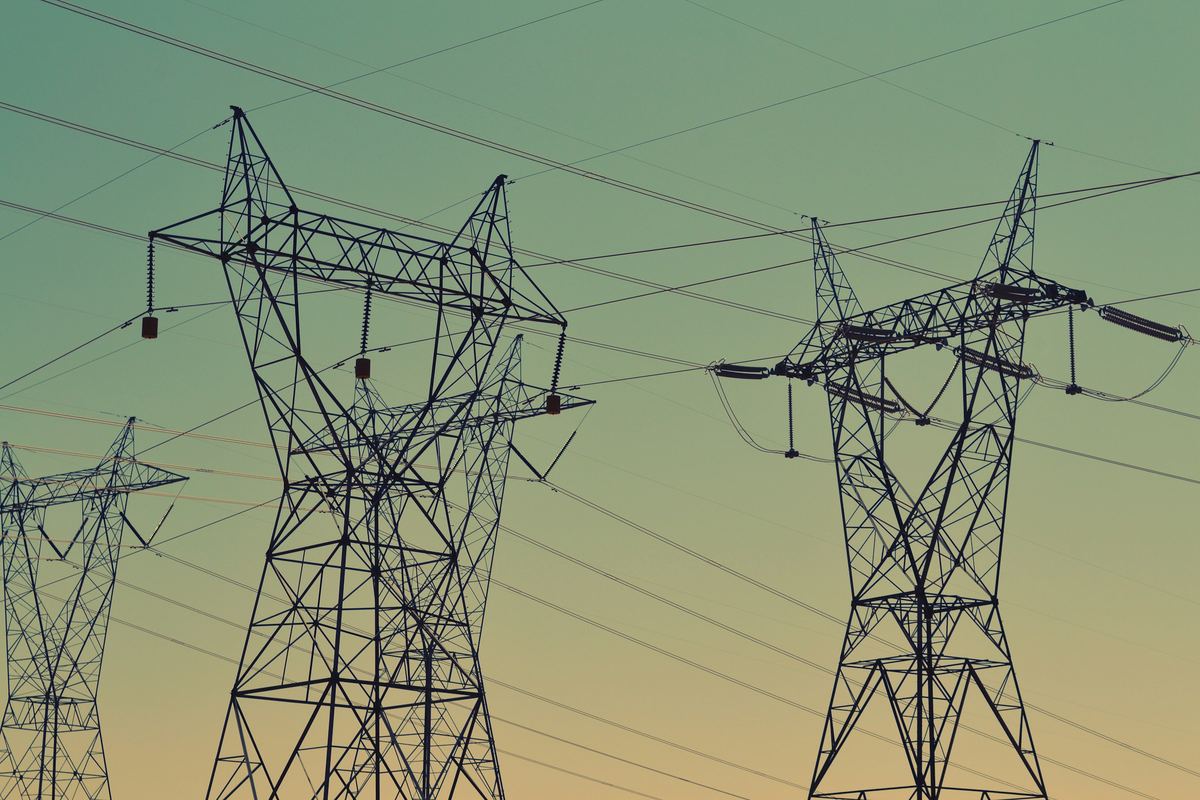 Infrastructure & UtilitiesNetwork planning and service coverage.
Tell us the area, the decision and the deadline. We reply within 24 hours, from the person who will deliver the work.
Based in Bucharest, working with clients on five continents.