
Inputs
Points
Stores, customers, competitors and leads become points, from your records or from places data such as Google Places. Census data adds population, households and income by area.
Home/Solutions/Location and market analytics
Where do things cluster, and where are the gaps?
Location analytics turns addresses into a view of the market: where customers and competitors cluster, and where demand is not served. Sales territory mapping then splits that market fairly between teams. We combine census, places and your own data, test the patterns statistically and deliver maps, dashboards and territories your team can work from.
A map of pins shows where things are, not what they mean. Hot spot analysis tests whether a cluster of stores or customers is real or chance, and white-space analysis compares demand with the locations that serve it, to find markets nobody covers yet.
Territories are the other half. Drawn by hand, sales areas drift out of balance; built from census population and adjacency, they stay balanced and can be redrawn automatically when the market changes.

Inputs
Stores, customers, competitors and leads become points, from your records or from places data such as Google Places. Census data adds population, households and income by area.
Analysis
We measure density and test clusters with hot spot statistics (Getis-Ord Gi*), compare demand with supply area by area, and follow trends over the years where records allow.
Result
Areas are grouped into territories balanced by population or accounts, keeping neighbours together and boundaries intact, and the results go to a dashboard or web map for the sales team.
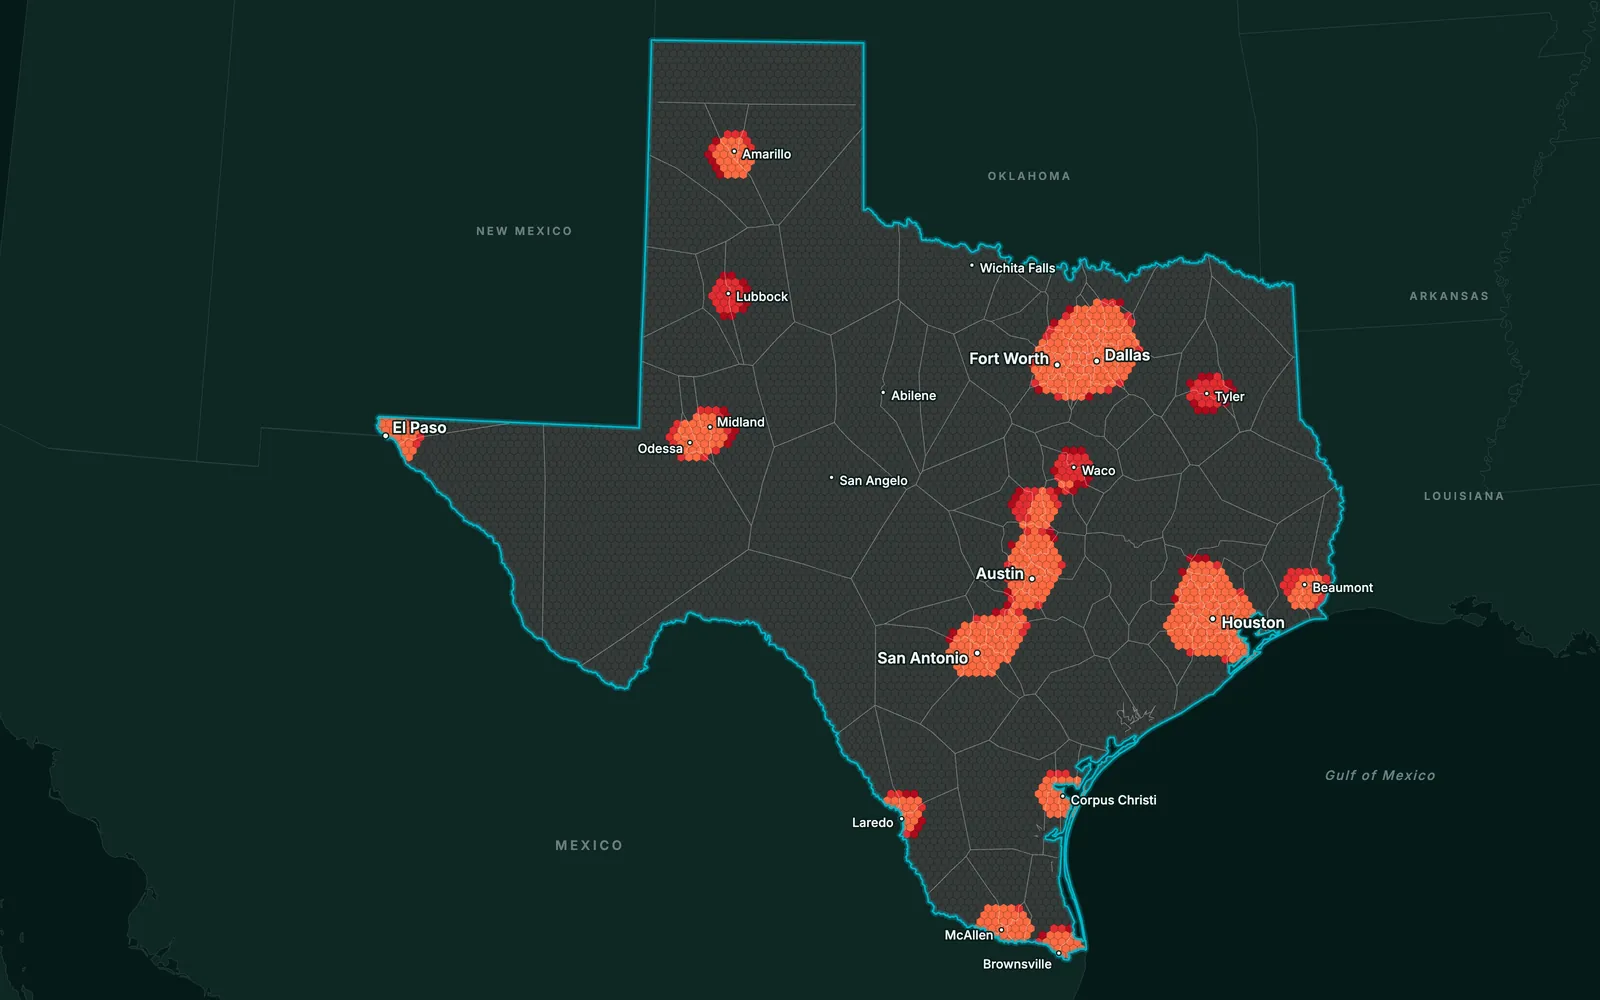
Statistically tested clusters of locations or customers.
Every competitor and prospect on one map, with their details.
Areas where demand is high and supply is thin.
Balanced groups of areas, as a map and a table.
Market statistics over time, in 2D or 3D web maps.
Limits
Places and census data lag behind the market and miss what is not listed, so the analysis shows patterns and priorities, not exact sales.
 Retail & Market IntelligenceCompetitors, white space, trade areas and sales territories for chains, franchises and sales teams.
 Real Estate & DevelopmentMarket trends by area over time, to see where activity and values are rising.
 Infrastructure & UtilitiesNetwork coverage by area, to see which places are served and which are not.
Spatial analysis of where things happen in a market: customers, competitors, stores and demand. It answers what a spreadsheet cannot, such as which clusters are real, which areas are under-served and how far each customer is from you.
From building blocks such as counties or postcodes, grouped so that each territory has a similar population or number of accounts, stays in one piece and respects state or regional boundaries. Sales territory mapping done this way runs as a script, so it can be rerun when accounts change.
A statistical test (Getis-Ord Gi*) that checks whether high or low values cluster more than chance would explain. It turns a crowded map of points into a few areas that are significantly hot or cold.
From your sales records, census and demographic data, and places data such as Google Places for competitors and leads. We document each source and its date, since market data ages quickly.
Yes. We build the analysis as a workflow, so new records or a new census year refresh the maps, dashboards and territories without starting over.
Tell us the area, the decision and the deadline. We reply within 24 hours, from the person who will deliver the work.
Based in Bucharest, working with clients on five continents.