
Home/Solutions/Proximity, access and catchment

Proximity, access and catchment analysis

Who and what is within reach?

Trade area and drive-time analysis measures reach the way people travel: along real roads and in minutes, not in straight lines. We draw isochrones and catchments around a store, a site or a service, count the people, customers or facilities inside them, and show where reach stops.

The question

A circle on a map is the quickest answer and usually the wrong one. A river with one bridge, a motorway with no exit nearby or a grid of one-way streets can put a place five kilometres away out of reach and bring a farther one closer. Travel time on the road network shows the catchment people actually experience.

The same tool answers different questions: who lives within 15 minutes of a planned store, how long it takes to reach the nearest hospital, how far each site is from the grid, or what lies within 10, 25 and 50 km of a project.

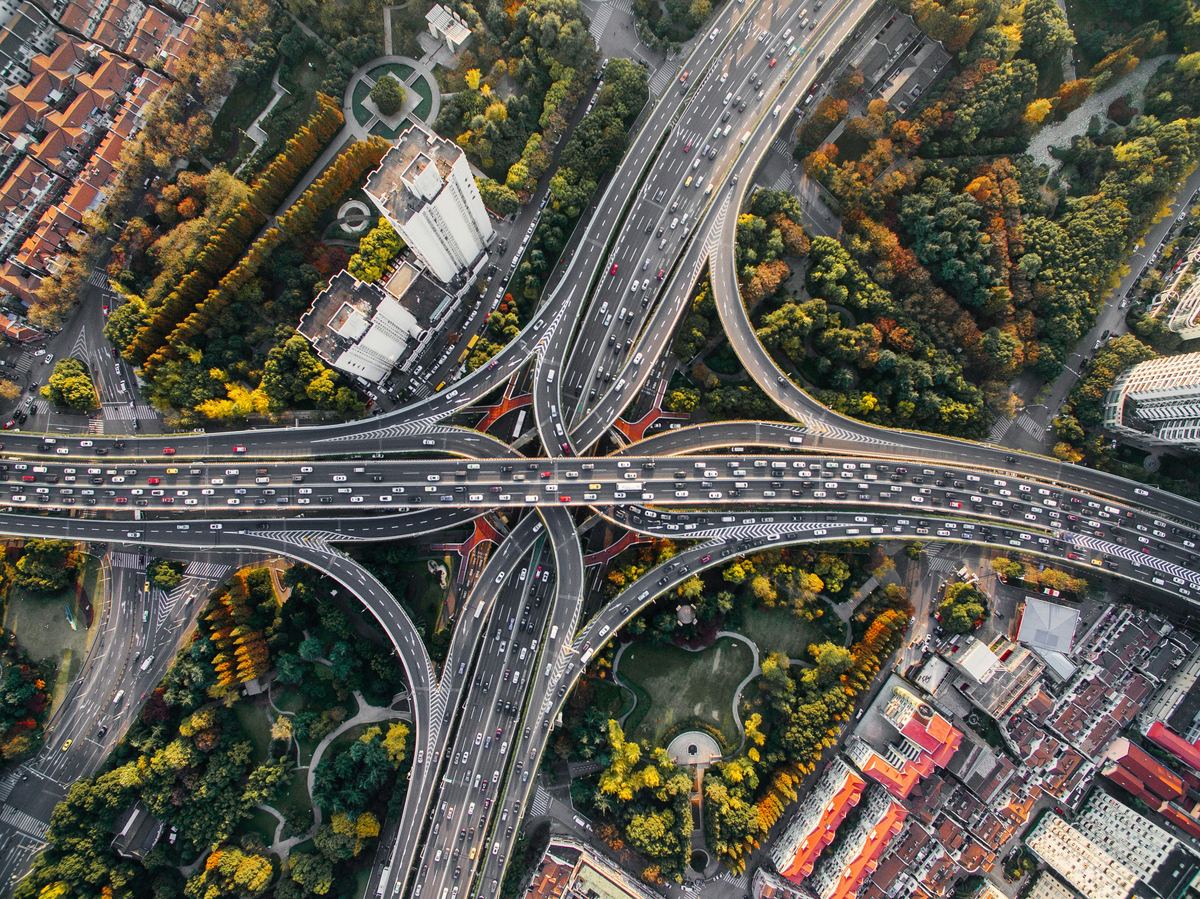
A roundabout and its roads, seen from above

From inputs to result.

Inputs

Network or distance

We pick the measure that fits the question: drive or walk time along a road network such as OpenStreetMap, or plain distance where travel does not matter, as for an environmental buffer. The origins are your sites, stores or facilities; the destinations are people, customers or services.

Analysis

Reach

Isochrones mark how far one can get in 5, 10 or 15 minutes; service areas split a region by its nearest facility. Census and demographic data inside each zone give the population, households or demand it holds.

Result

Gaps

Where reach is poor, the map shows it: neighbourhoods far from a clinic, demand no store serves, a site too far from the grid. Each gap comes with its size, so the team can decide where to act first.

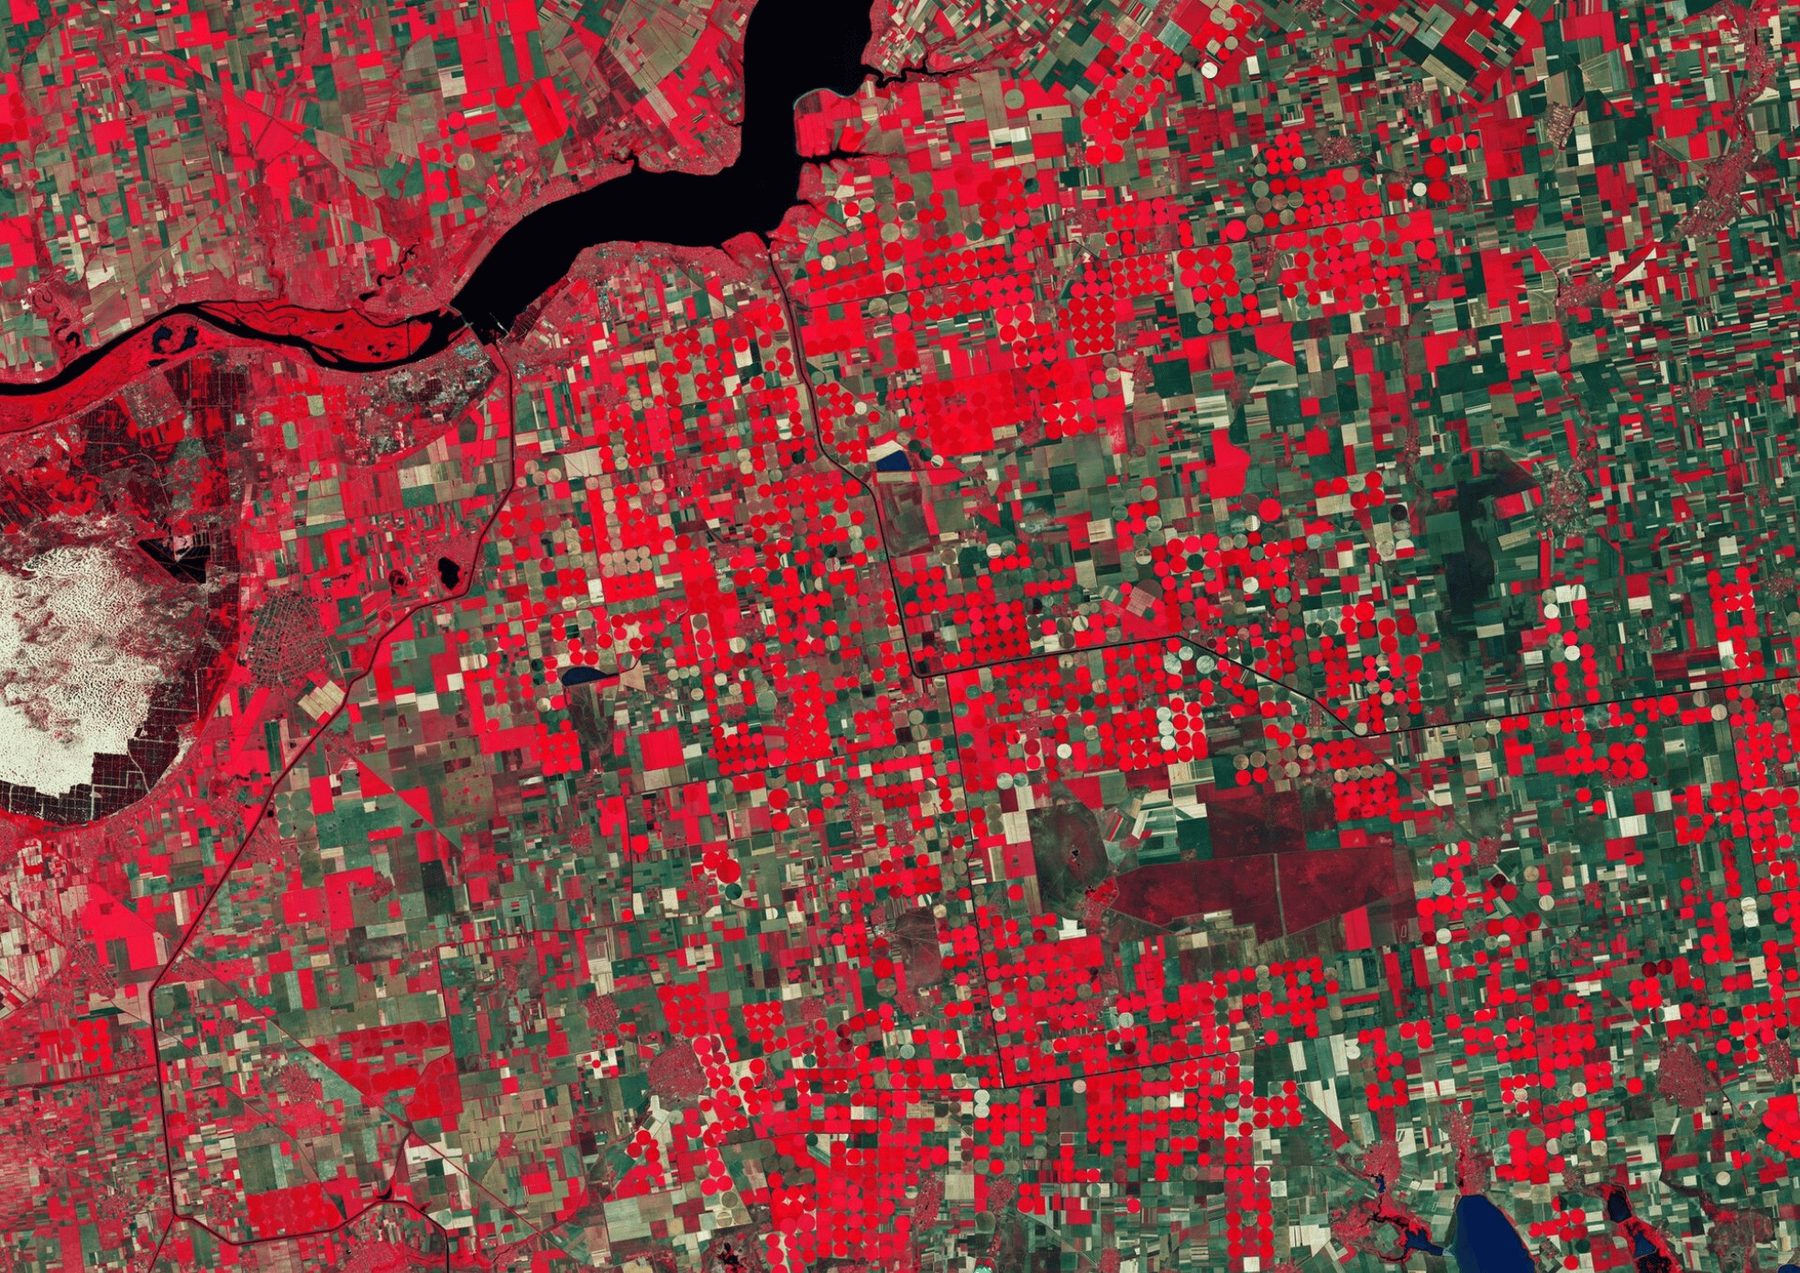
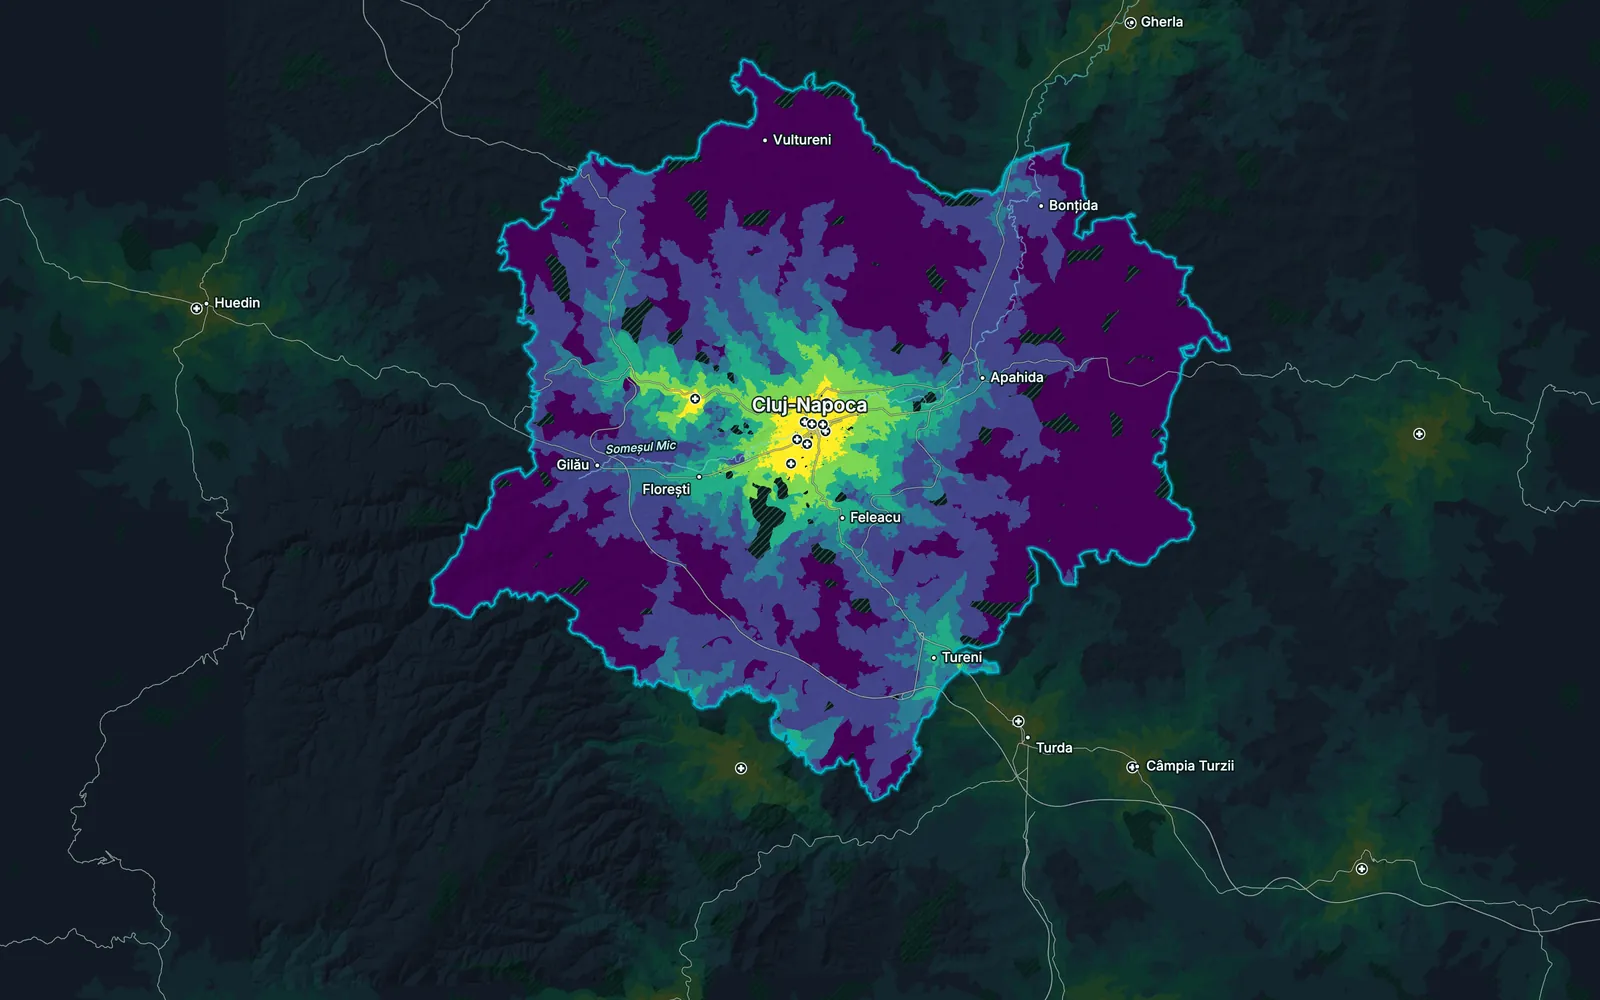
Drive time to the nearest hospital across the Cluj metropolitan area, Romania

What you receive.

01

Isochrone maps

Drive or walk times around each site, in the bands you choose.

02

Catchment profiles

Population and demographics inside each zone, as a table.

03

Nearest-⁠facility table

For every place, the closest facility and the time it takes to reach it.

04

Gap map

The areas outside reach, ranked by how many people live there.

05

Distance-⁠band screening

What lies within set distances of a site, such as 10, 25 and 50 km.

Limits

Travel times come from the road network and typical speeds, not live traffic, so reach at rush hour can be smaller than the map shows.

Questions about this analysis.

01Why use drive time instead of a radius?

Because people travel on roads. A radius treats a river, a ridge or a motorway as if they were not there; drive time does not. Trade area and drive-time analysis on the real network gives catchments that match how customers and residents actually move.

02Which ways of travel can you model?

Driving and walking on the road and path network, and straight-line distance where that is the right measure. For walking access to parks or schools we use footpaths as well as streets.

03Can you estimate how much demand a new store would take?

We size the demand inside its catchment from census data and show where it overlaps the catchments of your existing stores, so cannibalisation is visible before the lease is signed.

04Do you need our customer data?

It helps but is not required. With customer addresses we can map where sales really come from; without them, we estimate demand from census and places data.

05Can the analysis cover many sites at once?

Yes. It runs for one site or a whole network, and the table ranks every site by the population or demand it reaches.

Ready to put your geospatial data to work?

Tell us the area, the decision and the deadline. We reply within 24 hours, from the person who will deliver the work.

Based in Bucharest, working with clients on five continents.