
Before you commit
Is it a viable project?
Eligible land, forest history and the pressure on it, before you commit to a project area.
Home/Industries/Carbon, Forests & Environment
From the first feasibility map to every monitoring report. Environmental GIS for carbon and nature projects: baselines, deforestation monitoring and land suitability, as in Chaco Vivo and Mozambique.
Carbon projects are judged on maps: which land is eligible, what happened to the forest before the project, and what the project keeps afterwards. We build those maps from satellite time series for REDD+ and ARR projects, and cover IFM, ALM, wetland and soil-carbon projects on the mapping side.
The same tools map habitat for conservation and sites for waste and recycling: Sentinel-2 and other imagery, Google Earth Engine and GIS analysis, delivered as maps, web maps and data.
Our work spans REDD+ and ARR (afforestation, reforestation and revegetation): baseline development, leakage analysis, additionality support, suitability screening for new carbon projects, and ongoing MRV monitoring. We draw on Hansen Global Forest Change and satellite archives (Sentinel, Landsat) to keep baselines and monitoring defensible and repeatable.
Forest / Deforestation BaselinesBiomass & Carbon-Stock LayersDeforestation-Risk MapsMRV Monitoring ToolsSuitability Screening
The types of analysis we run in this industry, each with its examples here.
All eleven typesThe same three stages for every carbon project, ARR, REDD+ or any other type.
Before you commit
Eligible land, forest history and the pressure on it, before you commit to a project area.
The reference period
Land-cover and deforestation history from satellite time series, for the project area and the leakage belt.
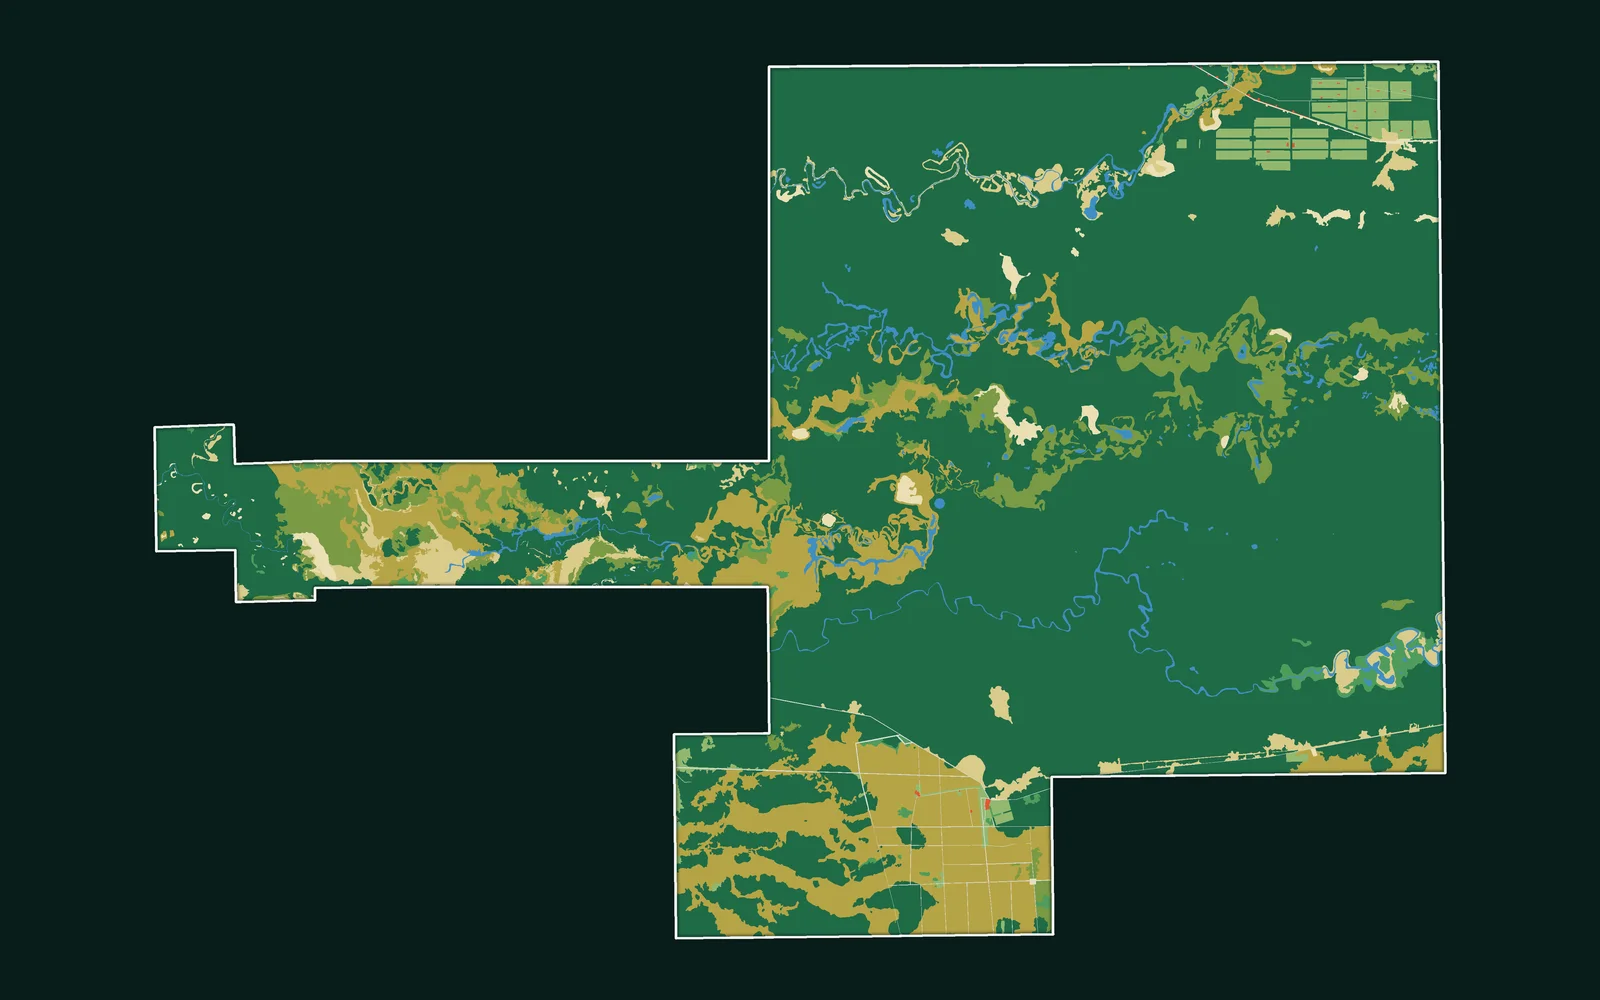
For every verification
Land-cover change, canopy and MRV maps, rebuilt the same way for each monitoring period.
The same work, in the form each person on your team needs.
Chaco Vivo REDD+
Project-area, baseline and monitoring maps, laid out for your project documents.
See the projectChaco Vivo REDD+
Project-area, baseline and monitoring maps, laid out for your project documents.
See the projectEvery map here is our own work; the caption under it says what it shows.
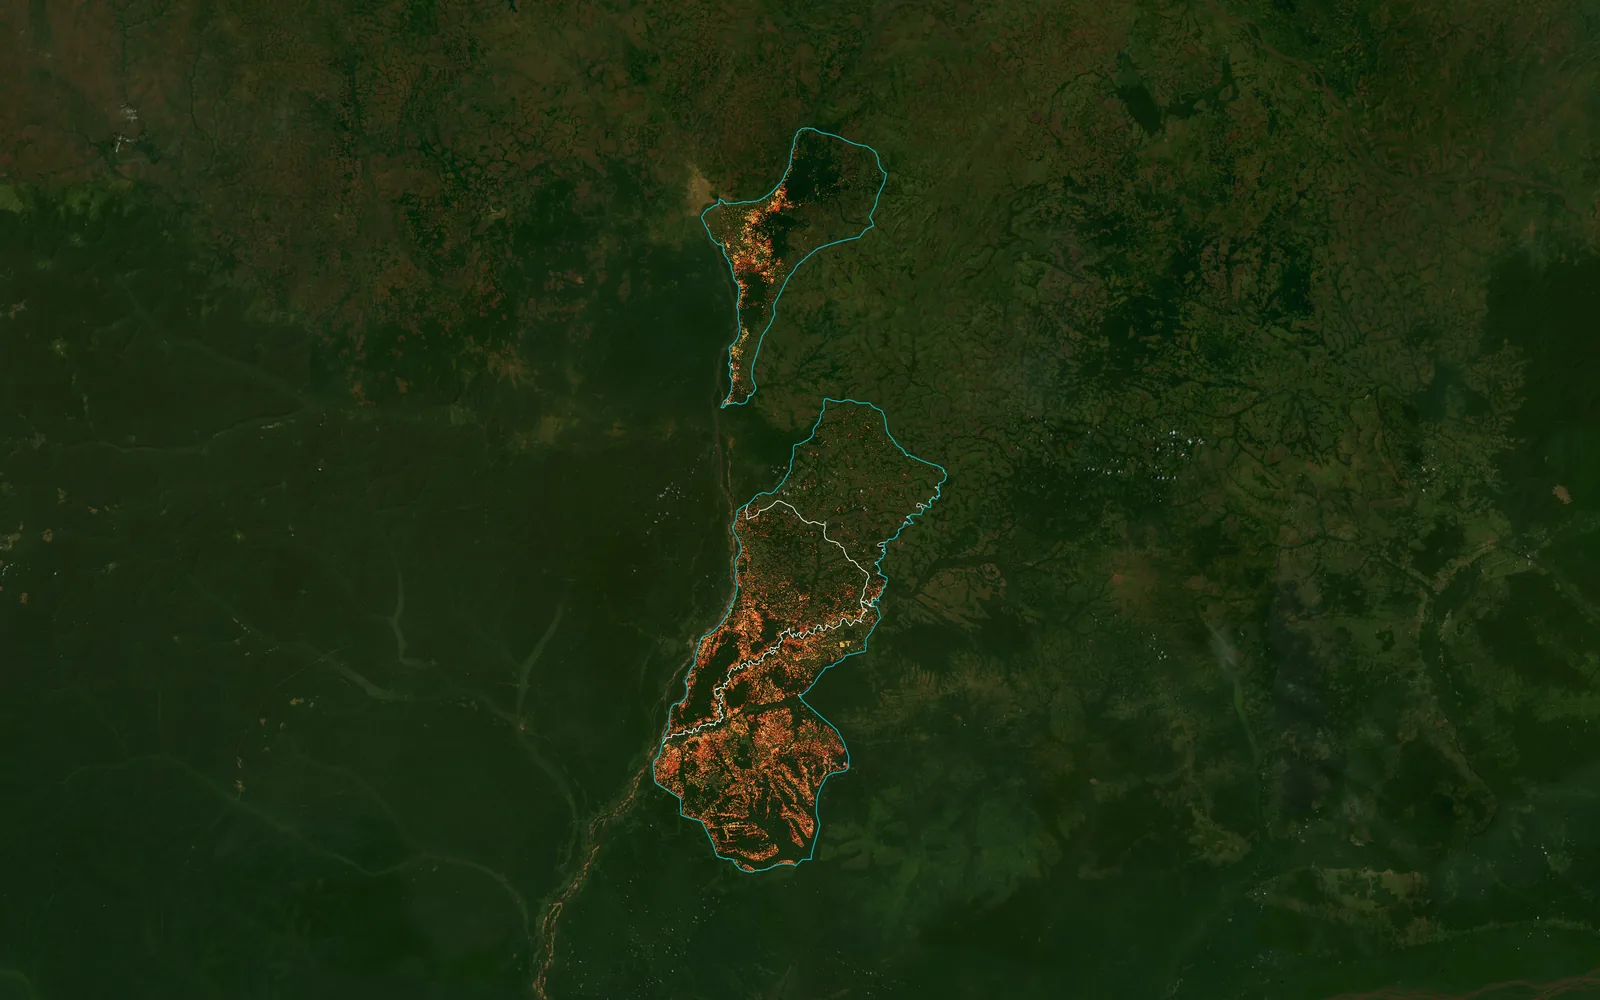
Tree cover loss 2001–2024 around four REDD+ project sites, Sud-Ubangi, DR Congo
Year of tree cover loss
The projects we delivered in this industry: open one to see its page or its whole map.
All projectsYes. We map eligible land, the forest's history and the pressure on it, so you know what the project area can carry before you commit.
Yes. Land-cover and deforestation history from satellite time series such as Dynamic World and Sentinel-2, for the project area and the leakage belt.
Yes, for the mapping side: forest, field and wetland extent, their history and their change. Our delivered carbon work so far is REDD+ and ARR.
No. We are not a registry, a verifier or a credit issuer. We make the maps and data that go into your project documents, under standards such as Verra VCS.
Yes. Earth Engine pipelines rebuild the land-cover maps for each new year, so every monitoring period uses the same method.
Yes — above-ground biomass and carbon-stock estimation from Earth-observation data.
Monitoring tools and recurring, reporting-ready outputs for Monitoring, Reporting and Verification.
Yes — suitability screening and deforestation-risk modelling for candidate areas.
The same way of working, for other kinds of project.
 Agriculture & Land ManagementCrop monitoring, field analytics and land-use change.
 EnergySite selection and land screening for renewable energy.
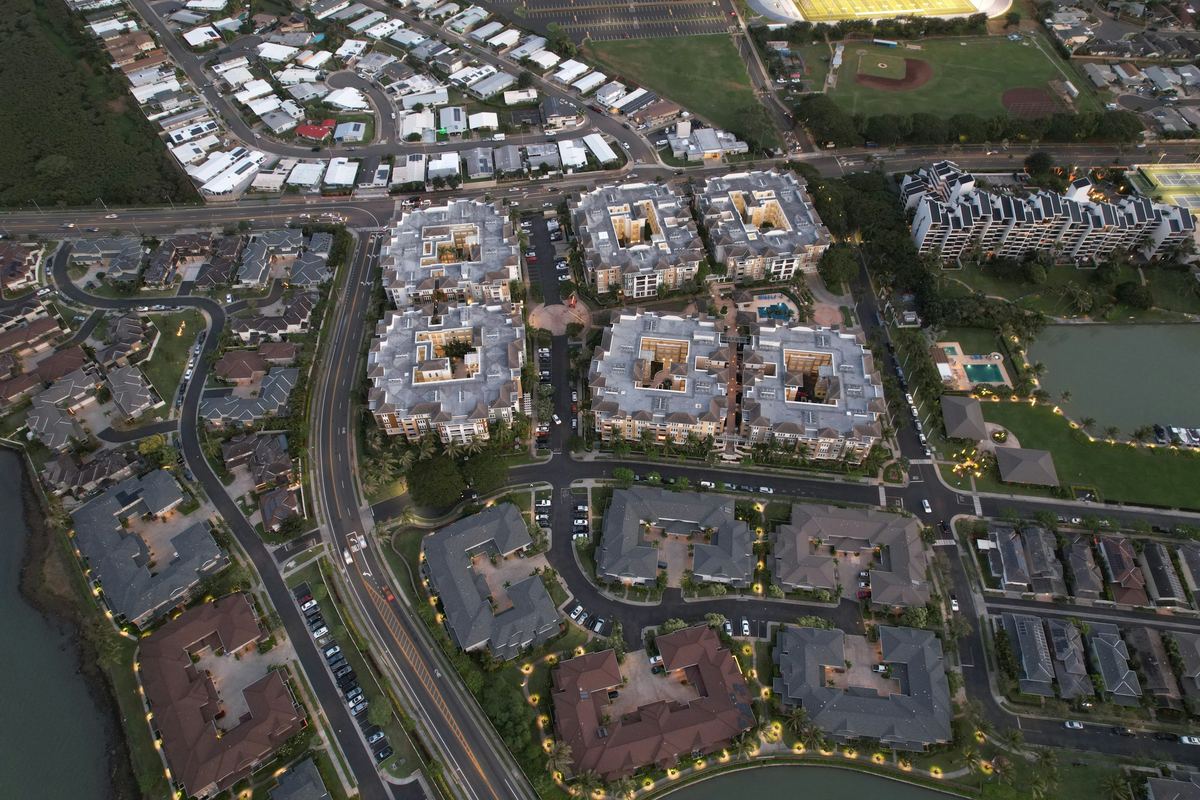 Real Estate & DevelopmentParcel screening, zoning and flood constraints.
 Retail & Market IntelligenceBest locations, trade areas and competitors.
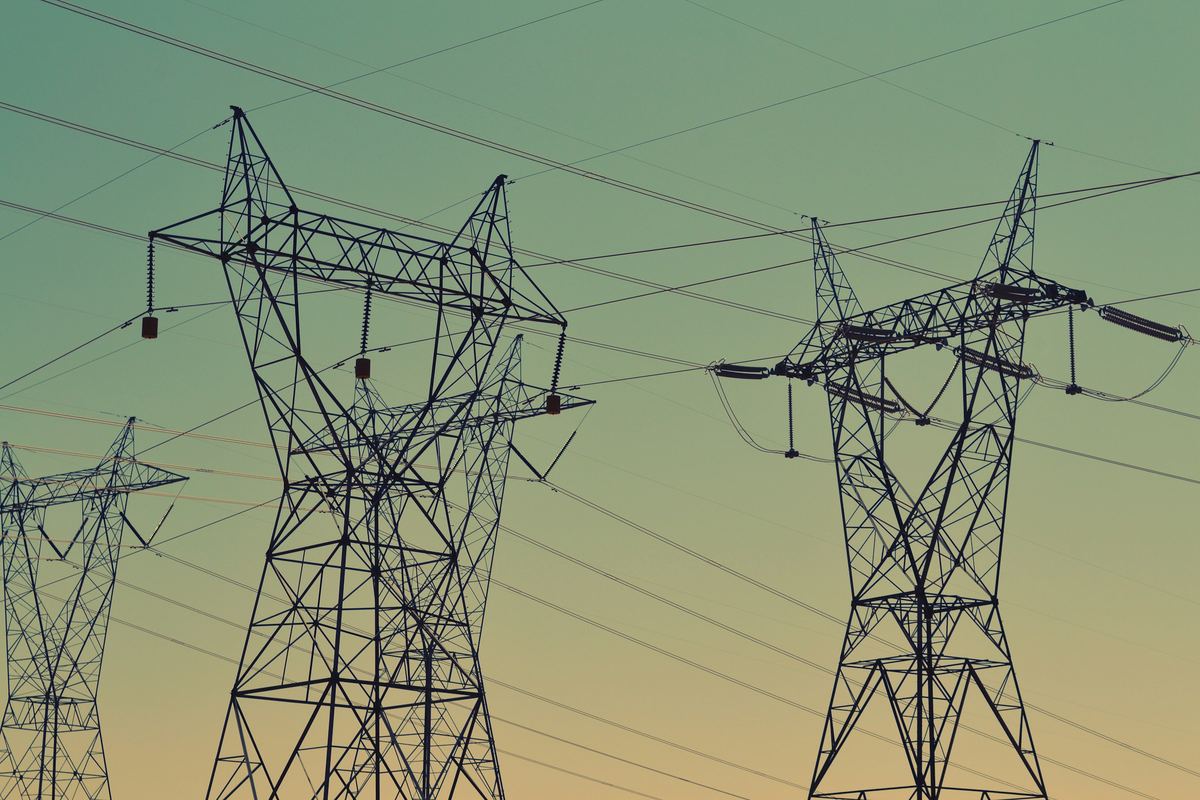 Infrastructure & UtilitiesNetwork planning and service coverage.
 Public Sector & Urban PlanningUrban planning, flood risk and public services.
Tell us the area, the decision and the deadline. We reply within 24 hours, from the person who will deliver the work.
Based in Bucharest, working with clients on five continents.