
Inputs
Time series
We gather every usable scene of the period, mask clouds and shadows, and build composites by month or season, often in Google Earth Engine, one of the tools we work with.
Home/Solutions/Wetlands, water and drought
Where is it wet, drying out or changing?
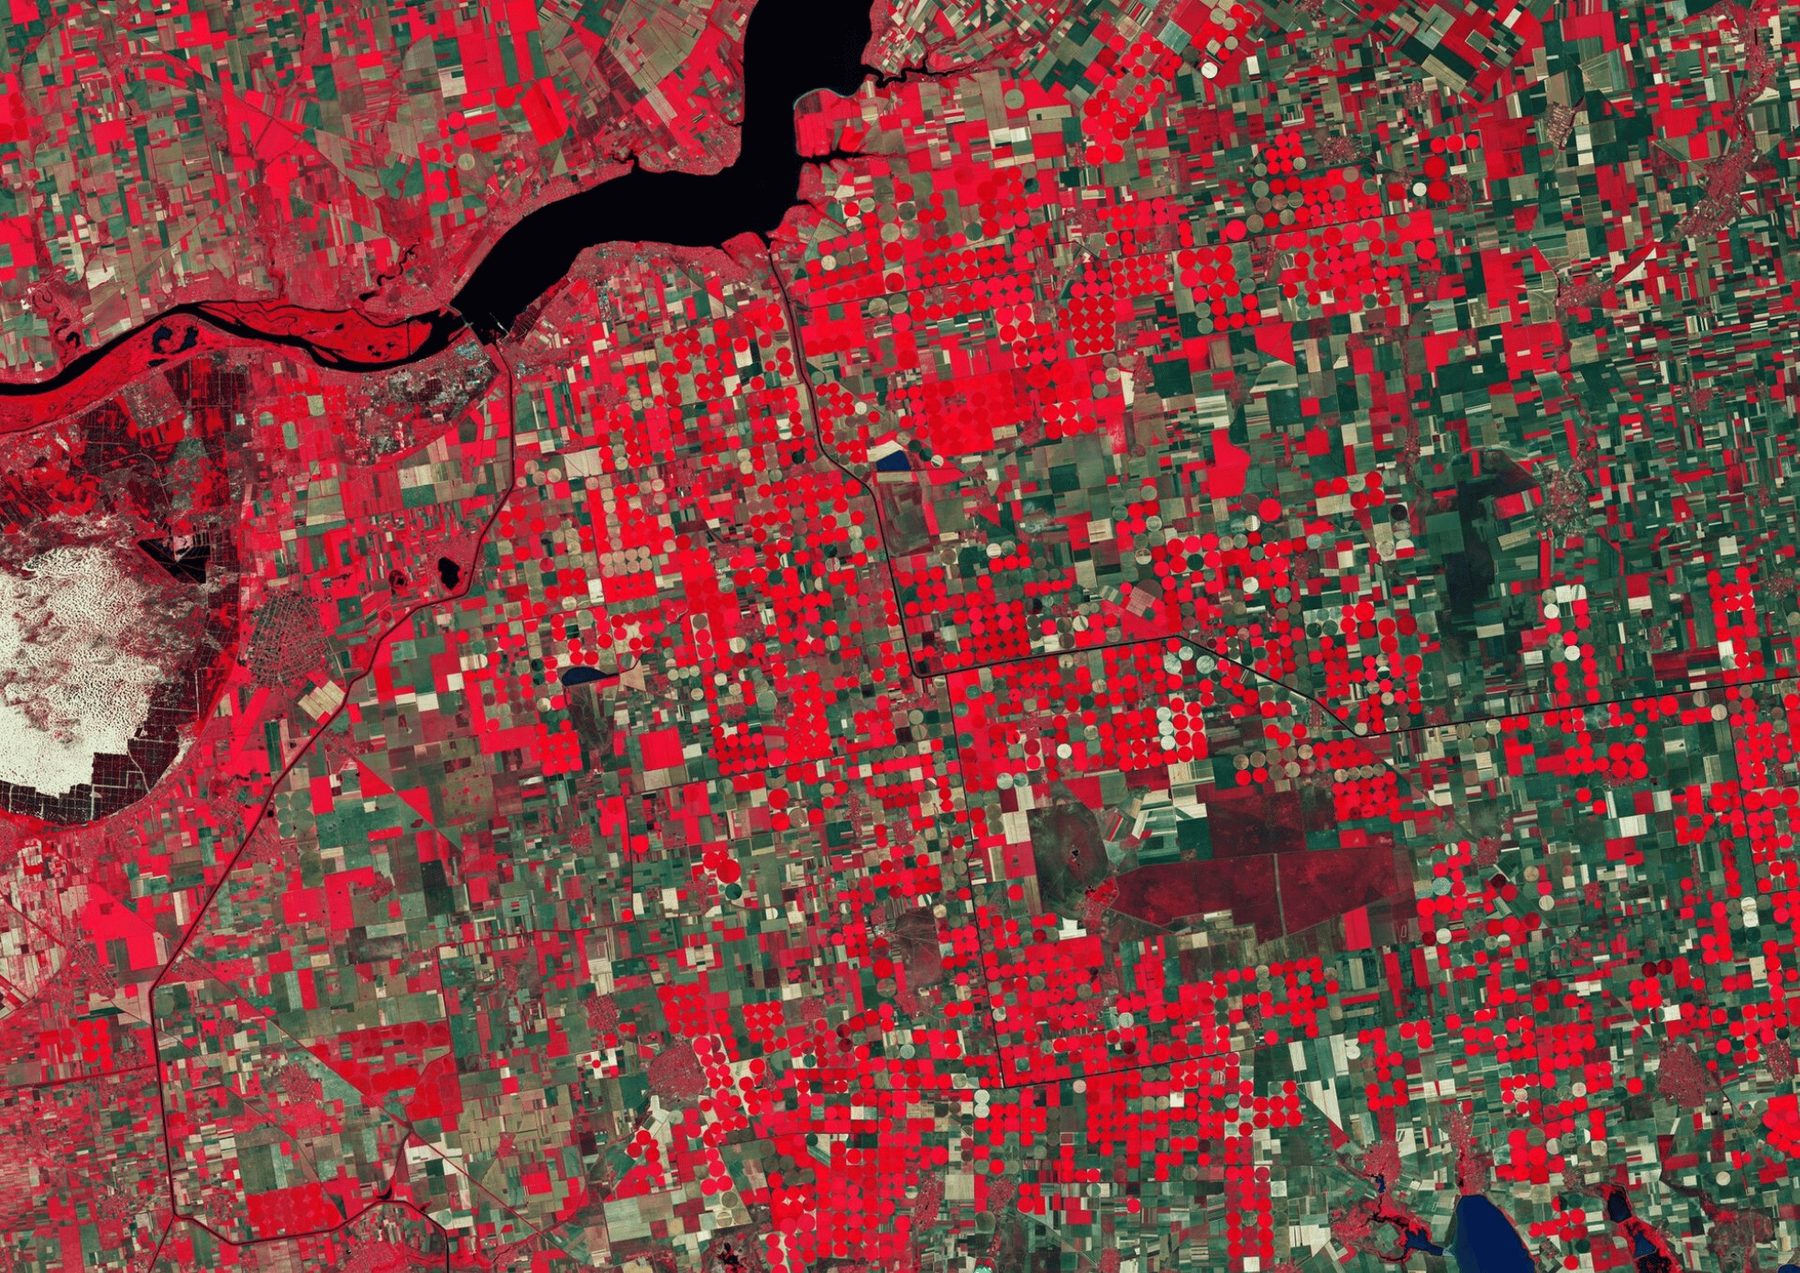
Wetland mapping with remote sensing follows water through the seasons: where it stands, where vegetation stays moist and where the land dries out first. We read years of Sentinel-2 imagery, classify water and wetland types or measure moisture, and turn the record into maps and areas you can plan with.
Water changes faster than almost anything else on the land. A marsh can spread in spring and shrink by late summer, and one dry year says little about the next. A single image cannot show that; a time series can, because it sees the same place again and again over the years.
The moisture index NDMI is one tool for this. Computed for the driest months over several years, it finds the refugia: the places that stay moist when the land around them is dry, where wildlife finds water and cover.
Inputs
We gather every usable scene of the period, mask clouds and shadows, and build composites by month or season, often in Google Earth Engine, one of the tools we work with.
Analysis
Two routes, depending on the question. Classification sorts the land into open water, marsh, reeds and dry land; a moisture index such as NDMI measures how wet the vegetation is, and its anomaly shows where a season is wetter or drier than usual.
Result
Classes and anomalies become areas by date and zone, and maps of where water or moisture persists. Persistence across many dry seasons is what separates a true refugium from one wet year.
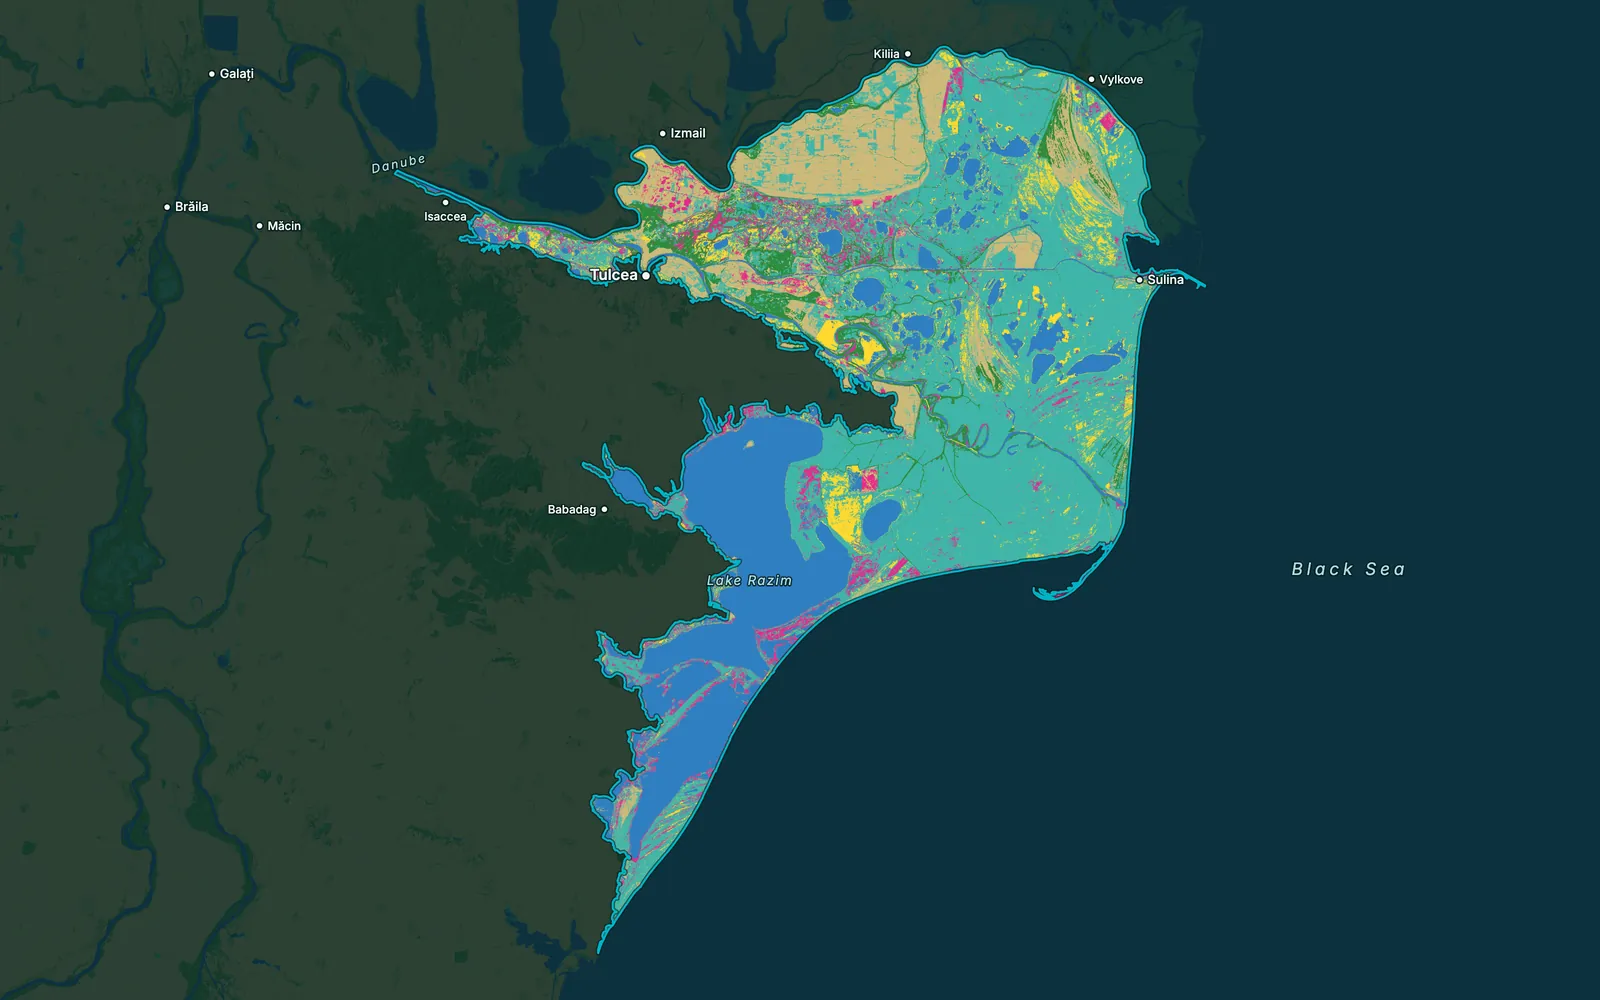
Open water, marsh and reed classes by date or season.
NDMI by month or season, ready to compare between years.
Where moisture holds through the driest periods, year after year.
Hectares of each class or moisture level, by date and zone.
The Earth Engine workflow, ready to run again on new seasons.
Limits
Clouds hide the ground in wet seasons, 10 m Sentinel-2 pixels blur narrow streams and small ponds, and dense reeds can hide the water beneath them.
It classifies satellite imagery into water and wetland types, such as open water, marsh and reeds, and follows how their extent changes over seasons and years. It covers areas too large or too wet to survey on foot.
The Normalized Difference Moisture Index compares near-infrared and shortwave-infrared light. Moist vegetation scores high and dry vegetation low, so a series of NDMI maps shows where the land holds water and where it dries out.
Yes. For the Australian Wildlife Conservancy we compared NDMI over the driest months of 2017 to 2024. Comparing many seasons separates places that stay moist every year from places that were wet only once.
They slow it down. We mask clouds scene by scene and build composites from the clear pixels of each month or season. In very cloudy regions a season may have too few clear views, and the report says where.
Wetland and blue-carbon projects are among the project types we cover on the mapping side: wetland classes, extent and change. The carbon projects we have delivered so far are REDD+ and ARR.
Tell us the area, the decision and the deadline. We reply within 24 hours, from the person who will deliver the work.
Based in Bucharest, working with clients on five continents.