
Inputs
Baseline
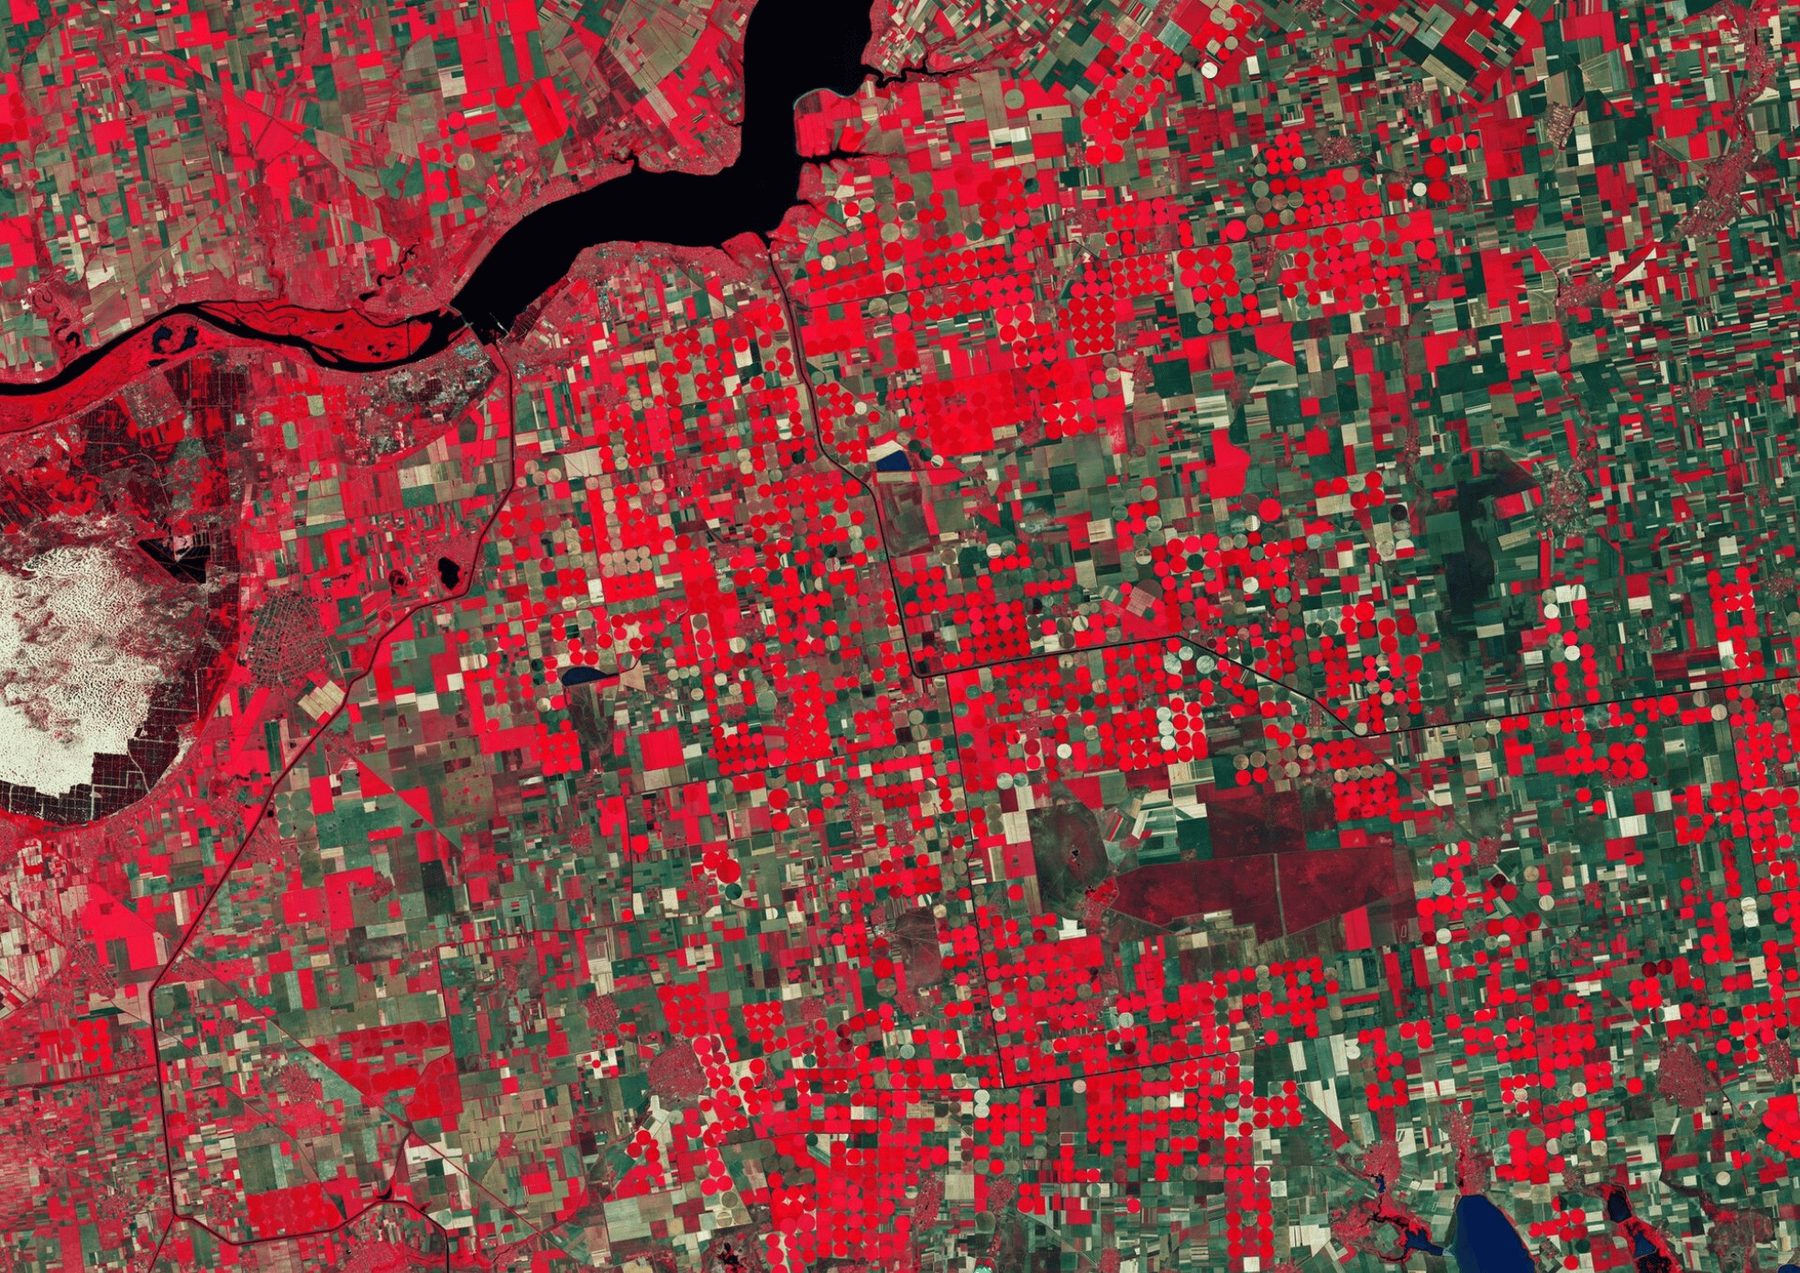
We classify land cover at the start date, forest and non-forest at least, from Landsat, Sentinel-2 or very-high-resolution imagery, and check it against global products such as Hansen Global Forest Change and Dynamic World.
Home/Solutions/Forest, carbon and land-cover change
What changed, where and when?
Deforestation monitoring from satellite imagery shows what happened to a forest, where and in which year, across the whole area and back in time. We build the baseline, map the change between dates and report it as areas and maps, for carbon projects, conservation and any site where the land itself is the question.
Satellite archives keep a record of the land going back many years. Landsat gives the long history, Sentinel-2 adds 10 m detail, and global products such as Hansen Global Forest Change map tree cover loss year by year. The history of a forest can be measured instead of remembered.
For carbon projects the dates matter as much as the areas. A REDD+ project needs the deforestation of a reference period; an ARR project has to show that the land was not forest before. We map both, with the classes and periods the project's methodology asks for.
Inputs
We classify land cover at the start date, forest and non-forest at least, from Landsat, Sentinel-2 or very-high-resolution imagery, and check it against global products such as Hansen Global Forest Change and Dynamic World.
Analysis
Each later date is classified the same way and compared, or a time series is read pixel by pixel to find when the change happened. Clouds are masked and small specks removed, so the change map shows real loss and gain, not noise.
Result
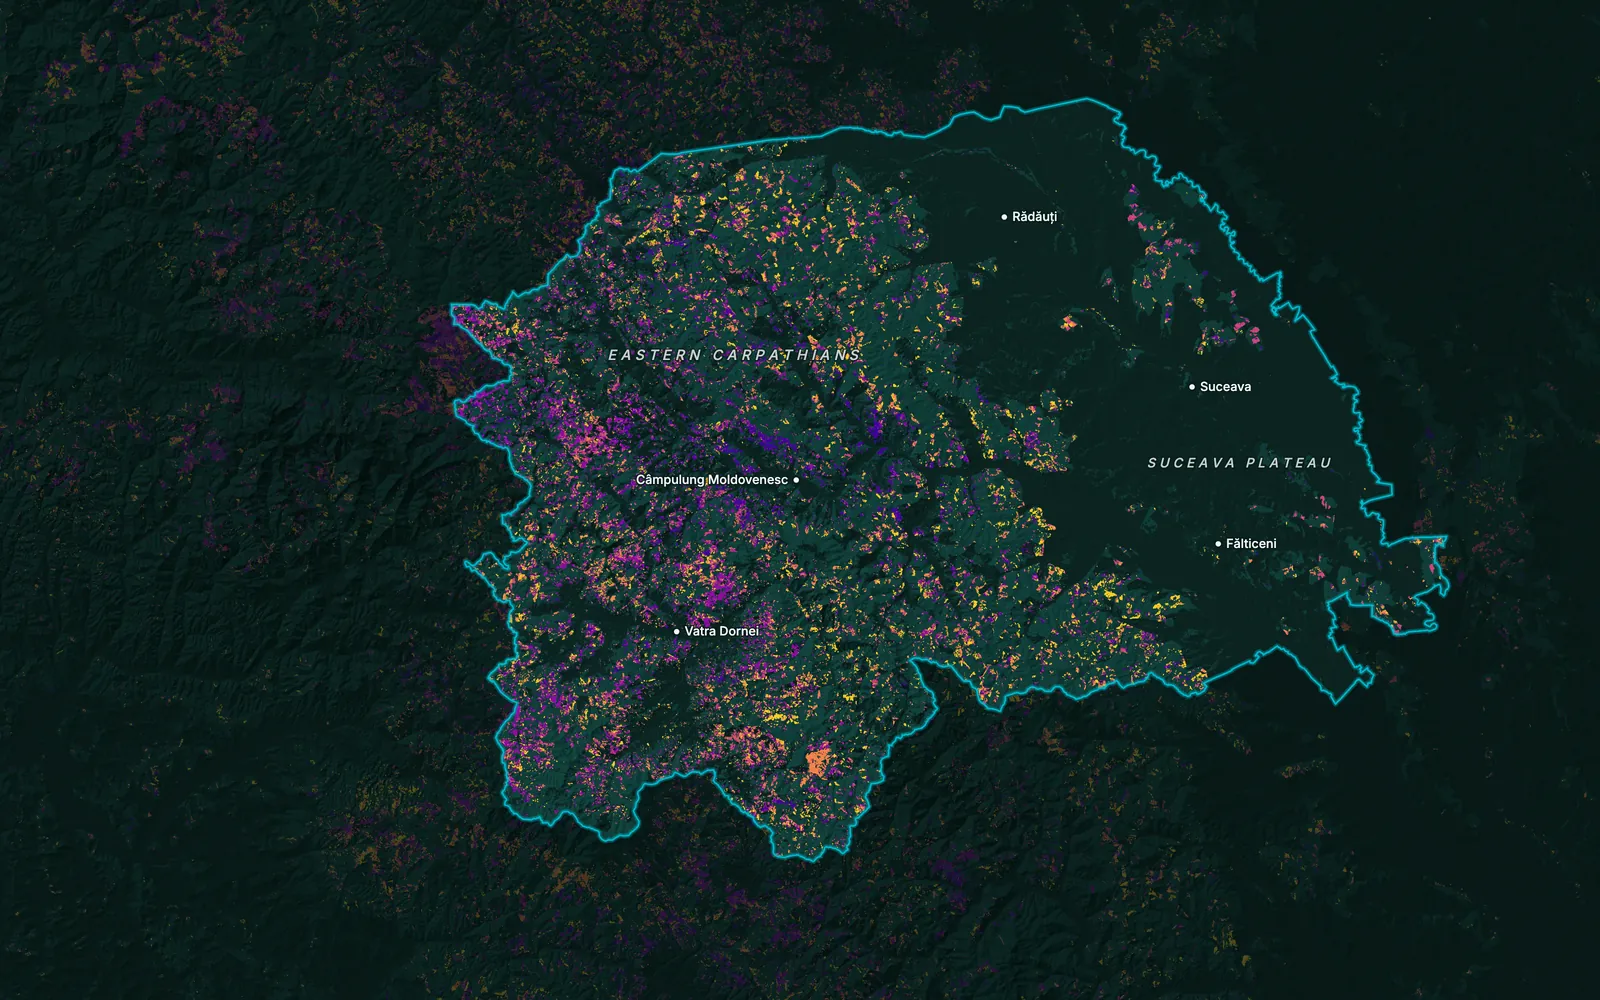
Change is summed by year, class and zone: inside the project, in the leakage belt, by parcel. Maps and tables go into the report, and the same workflow runs again for the next monitoring period.
Classes at the start date, with an accuracy check against reference points.
Loss and gain by period, coloured so the years read at a glance.
Hectares changed by year, class and zone.
The regions and belts a REDD+ baseline needs, mapped and measured.
A script that repeats the analysis each period, built with tools we work with such as Google Earth Engine.
Limits
Optical imagery needs clear skies, and 10–30 m pixels can miss small clearings and selective logging; very-high-resolution or radar imagery closes part of that gap.
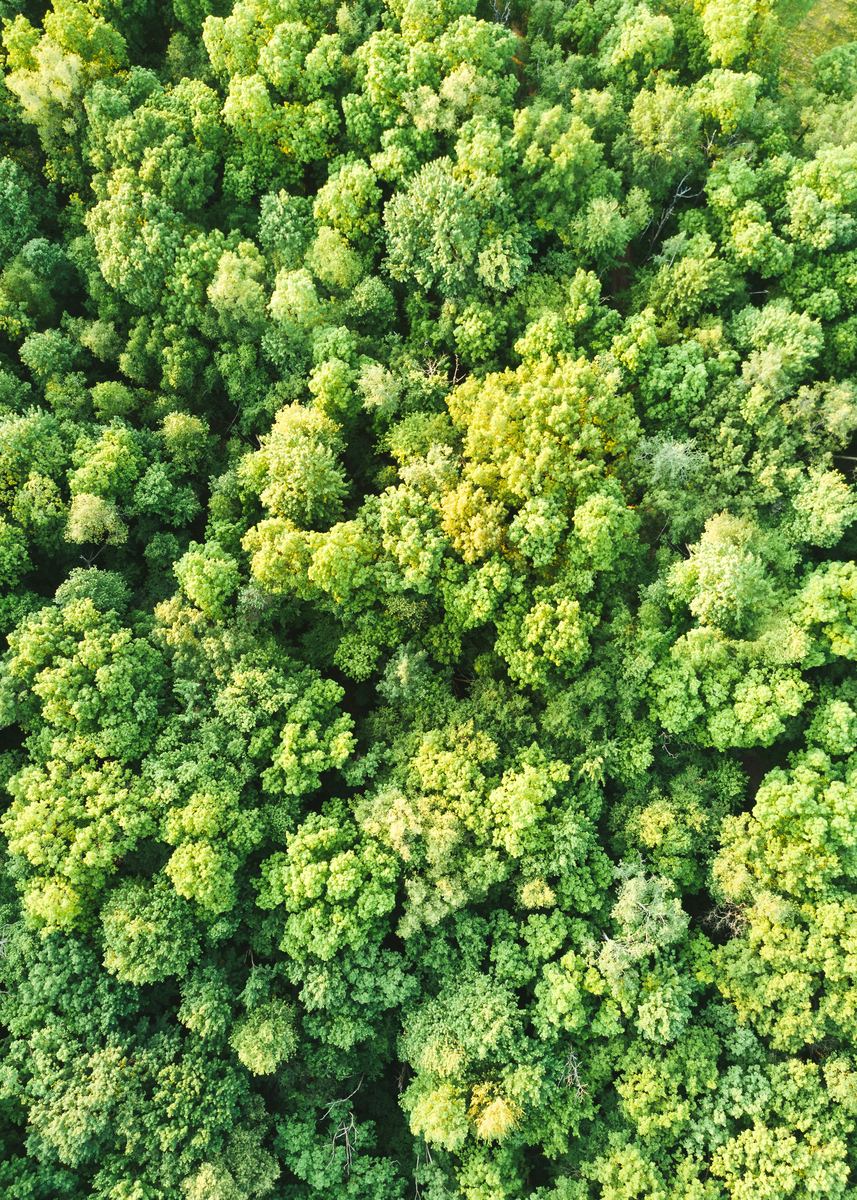 Carbon, Forests & EnvironmentREDD+ baselines and leakage belts, ARR land eligibility, and monitoring for carbon and conservation projects.
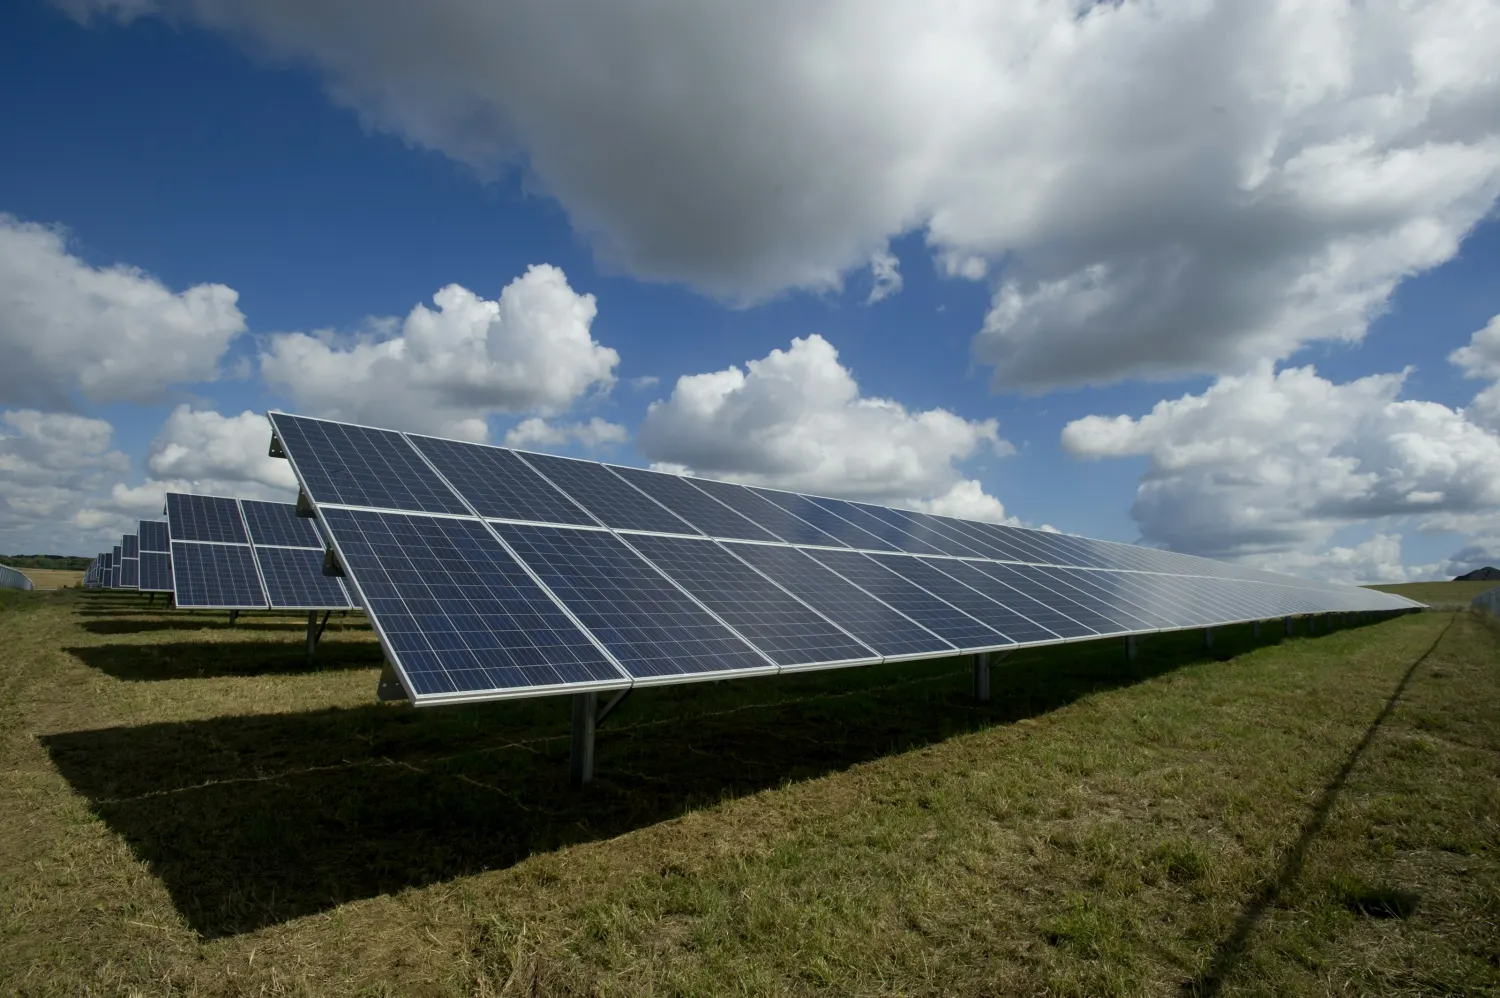 EnergyLand change on a solar or wind site during construction, from imagery before and after.
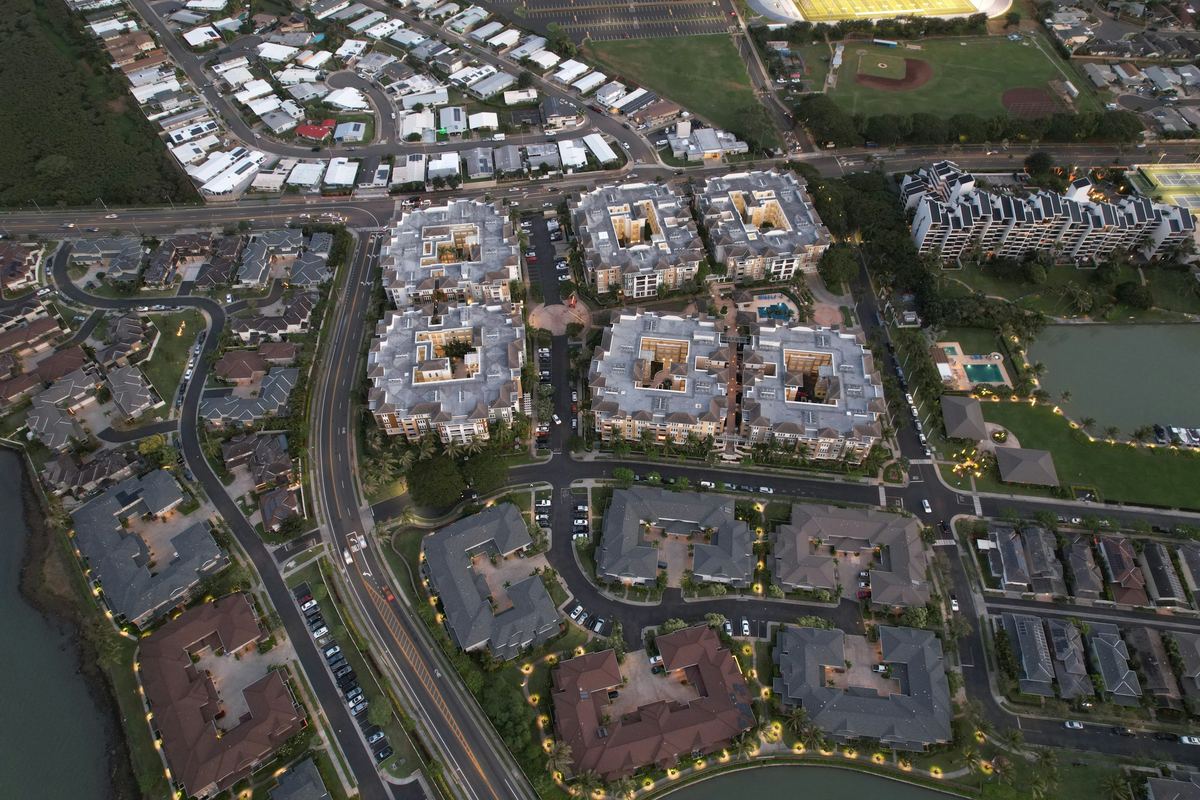 Real Estate & DevelopmentConstruction and land change on a development site between two dates.
Imagery from two or more dates is classified into forest and other land, and the classes are compared. Where forest turns into something else, the pixel counts as loss for that period. The result is a map of where and when, and a table of how much.
Landsat for the long history, Sentinel-2 for 10 m detail, and very-high-resolution imagery such as Pléiades Neo or WorldView where small clearings matter. Global layers such as Hansen Global Forest Change and Dynamic World serve as a check or a starting point.
Yes. We map the reference region, the historical loss and the leakage belt to the methodology the project follows. For Chaco Vivo REDD+ in Paraguay we did the baseline mapping, the deforestation monitoring and the MRV design.
Yes. Land planted under ARR must not have been forest for the years the standard sets before the project. We map land cover at that reference date and today, and mark the land that qualifies and the land that does not.
No. We produce the maps and analysis that a project and its auditors work from. Verification belongs to an accredited body, and issuance to the registry.
Tell us the area, the decision and the deadline. We reply within 24 hours, from the person who will deliver the work.
Based in Bucharest, working with clients on five continents.